

Climate data is now part of ESG reporting, financial disclosure, portfolio screening, lending, insurance discussions, and resilience planning. Investors ask for it. Regulators increasingly expect it. Organizations need to understand how physical climate hazards could affect assets, operations, supply chains, and long-term strategy.
This has created a fast-growing market for climate analytics. Many tools now provide downscaled projections, hazard layers, risk scores, and sometimes financial loss estimates at the level of individual properties.
These tools can be useful. They can help organizations screen large portfolios, identify potential exposures, support disclosure, and decide where deeper review is needed. But they are often misunderstood.
A common mistake is to treat climate-model output, downscaled datasets, hazard indicators, and risk scores as if they were direct forecasts of future asset-level risk. They are not. They are analytical products built through layers of assumptions about models, data, hazards, exposure, vulnerability, and future human behavior.
The issue is not that climate data is unreliable or that climate analytics should be avoided. The issue is that climate data must be matched to the decision being made.
A useful way to think about the problem is as a translation chain:
Each step adds assumptions. Each assumption may be reasonable. But uncertainty compounds as the analysis moves from global climate science toward property-level risk or dollar-denominated loss.
For ESG teams, risk managers, investors, and infrastructure owners, the practical question is not simply, “What does the dataset say?”
The better question is: what can this dataset support, what assumptions does it depend on, and what additional evidence is needed before making a decision?
This post explains four common myths about climate data in ESG reporting and how to use these tools more responsibly.
Myth #1: Bias correction eliminates the need to worry about climate model error
Bias correction can improve the historical realism of climate-model output, but it does not fix the underlying climate model.
Global climate models simulate the climate system on large three-dimensional grids. A single grid cell can cover tens to hundreds of kilometers. Within that grid cell, mountains, coastlines, cities, vegetation, lakes, and local weather patterns are represented only approximately. This means raw climate-model output often differs from observed local conditions.
A model may be too warm or too cool in a region. It may produce too much or too little rainfall. It may misrepresent seasonal cycles, humidity, wind, or extremes. These differences do not make the model useless. But they do mean that additional processing is often required before the data can be used for local analysis.
Bias correction is one of the most common processing steps. It adjusts model output so that the historical model climate better matches a reference dataset. This can make climate data more useful for many applications, especially when the goal is to estimate local temperature or precipitation distributions.
But bias correction has limits.
Bias correction depends on the reference data
Bias correction is only as reliable as the dataset used to train it. Many datasets described casually as “observations” are not direct measurements. Some are reanalysis products, gridded datasets, or blends of models and observations.
This distinction matters. If a climate model is bias-corrected against a dataset that already contains model-based biases, the corrected output may align with another model’s version of the world rather than with local measurements.
For applications that depend on site-level temperature, wind, humidity, or rainfall, station observations remain an important benchmark. Reanalysis products can be extremely valuable, but they are not the same thing as observations at a specific location.
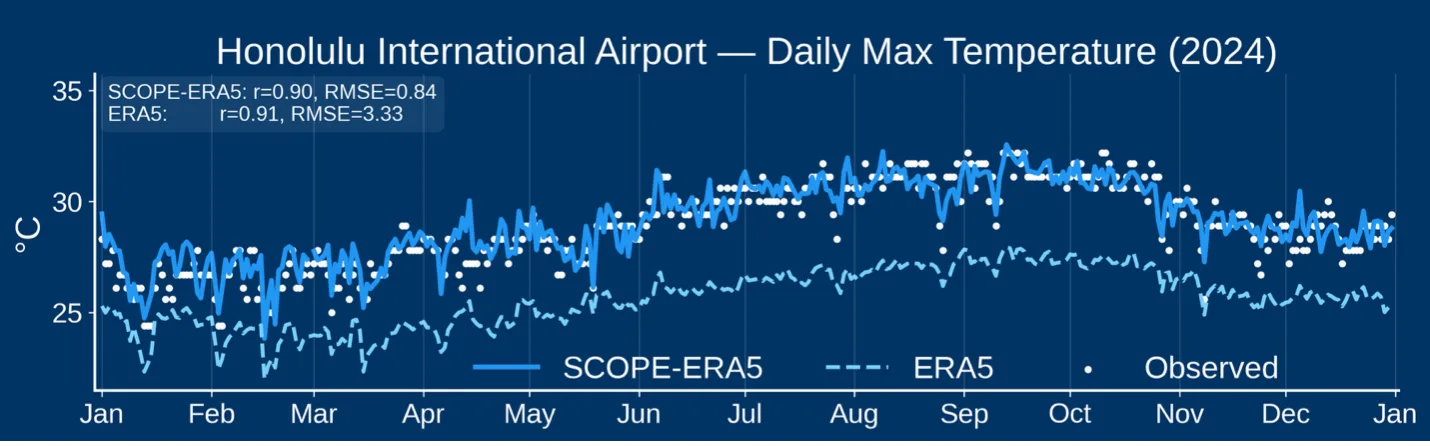
ERA5 is a commonly used training dataset for climate model bias correction, but it represents model output rather than direct observations. As a result, it can exhibit significant biases relative to observed data. Daily maximum temperature in Honolulu, Hawaii is one example. A bias-corrected version of ERA5 (SCOPE-ERA5) better matches observations.
Bias correction does not add missing events
Many high-impact hazards are not directly resolved by global climate models. Local convective downpours, tornadoes, hail, thunderstorm wind gusts, flash floods, and some aspects of tropical cyclone risk occur at scales that are much smaller than typical global climate-model grids.
Bias correction can adjust model variables such as daily temperature or precipitation. It cannot simply insert the missing storm dynamics, drainage failures, wind gusts, or flood pathways that determine many real-world losses.
When these hazards are material, specialized hazard modeling is needed.
Bias correction improves historical fit, not future certainty
Bias correction is usually trained on historical data and then applied to future projections. This assumes that the correction needed in the past remains valid in the future.
That assumption may be reasonable for some variables and applications. But it is not guaranteed. If the physical processes controlling a local climate change over time, a correction derived from the past may not hold under future conditions.
Bias correction can make historical output look more realistic. It does not guarantee that the future trend, extreme-event behavior, or local response to warming is correct.
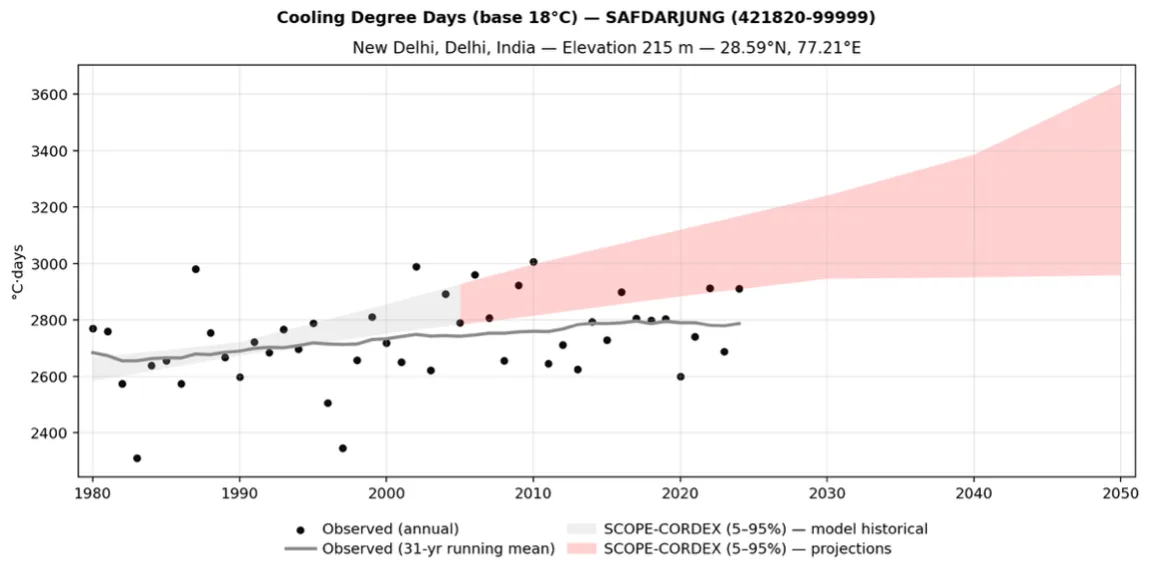
Observed and projected annual cooling degree days for New Delhi, India. Model projections from SCOPE-CORDEX show a steeper rise in cooling demand than observed historical trends. Bias correction techniques cannot correct for issues where model projected trends do not match observations.
Method choice matters
There are many bias correction methods. Some adjust only averages. Others adjust the full distribution. Some attempt to preserve climate-model trends. Others can unintentionally alter the model’s projected changes, especially in the tails of the distribution where extremes occur.
This matters because ESG and resilience applications often care most about rare or severe conditions: very hot days, intense rainfall, low-probability floods, or extreme wind events. Small methodological choices can have large consequences when the analysis is focused on extremes.
Questions to ask
Before relying on bias-corrected climate data, ask:
- What reference dataset was used for calibration?
- Is the reference dataset based on observations, reanalysis, remote sensing, or another model?
- Does the method preserve the climate model’s projected changes?
- Has the corrected output been evaluated against local observations?
- Are the variables and extremes relevant to the decision actually represented by the model?
Bias correction is useful. But it is not a warranty that climate-model output is locally accurate or decision-ready.
Myth #2: Climate models capture the extreme weather events businesses care about
Climate models are powerful tools for understanding large-scale climate change. They are not direct simulators of every hazard that damages assets and disrupts operations.
This distinction is critical for ESG reporting and physical risk assessment.
Most financial and operational climate risks arise from specific hazards: flood depths, extreme wind gusts, wildfire spread, storm surge, hail, drought stress, heat waves, and infrastructure failures. Some of these hazards are partially represented in climate models. Many are not represented directly at all.
A climate model may project changes in temperature, precipitation, humidity, pressure, or large-scale wind. But businesses often need to know something more specific:
- Will this warehouse flood?
- Will this road become impassable?
- Will this substation overheat?
- Will this facility lose power during a compound wind and heat event?
- Will drainage capacity be exceeded during a short-duration storm?
- Will wildfire smoke disrupt operations?
- Will a supply chain node become inaccessible?
These questions require more than climate-model output.
The hazard is not always the climate variable
Rainfall is not the same as flooding. Wind speed in a climate model is not the same as damaging gust risk. Fire weather is not the same as wildfire loss. Drought indices are not the same as water availability.
A climate variable may be one input to a hazard model, but it is rarely the full hazard itself.
For example, flood risk depends on rainfall intensity, terrain, drainage, soil moisture, impervious surfaces, channel capacity, flood defenses, tides, storm surge, infrastructure maintenance, and land use. Climate models can inform some of these drivers, but they do not directly estimate site-specific inundation depths.
Similarly, wildfire risk depends not only on hot, dry, windy conditions, but also on fuels, ignition sources, land management, suppression capacity, building materials, defensible space, and emergency response.
Treating climate variables as direct risk indicators can produce misleading results.
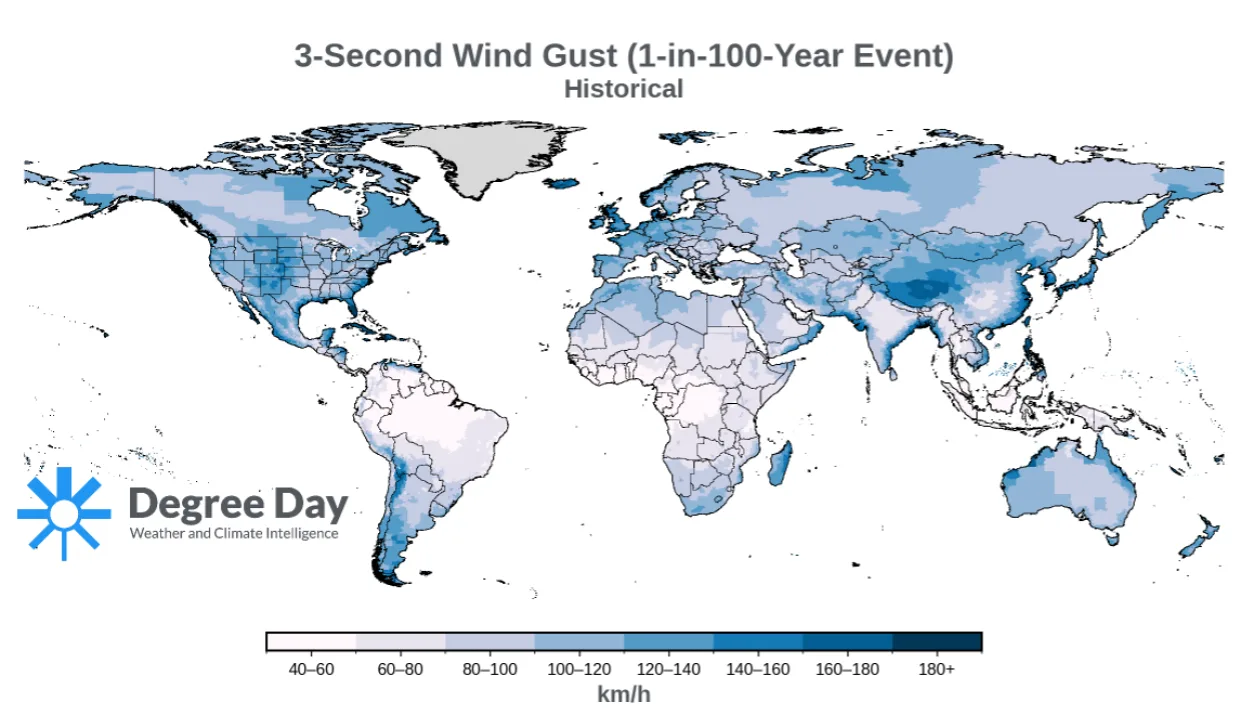
Extreme wind gusts are not simulated by global climate models and require separate hazard modeling approaches to properly capture hurricanes, mid-latitude cyclones, and other weather phenomena that produce extreme wind gusts.
Hazard modeling is often required
For many hazards, the appropriate workflow is not a one-step jump from climate model to risk score. It runs through the hazard mechanism that actually drives losses:
That may involve hydraulic modeling for flooding, tropical cyclone modeling for wind and storm surge, fire behavior modeling for wildfire, or engineering analysis for heat-sensitive infrastructure.
Climate models can still provide useful information. They can indicate how background conditions may shift, how rainfall distributions may change, how heat stress may increase, or how sea level may alter coastal flood frequency. But they need to be translated into the hazard mechanism that matters for the decision.
Non-climate hazards still matter
ESG climate assessments can also crowd out other natural hazards that may be material to business continuity and resilience: earthquakes, tsunamis, volcanic hazards, landslides, geomagnetic storms, and other low-frequency, high-impact events.
A resilience assessment should not treat climate change as the only source of physical risk. For many organizations, the most consequential hazards may involve both climate and non-climate stressors, interacting through infrastructure, supply chains, operations, insurance, and emergency response.
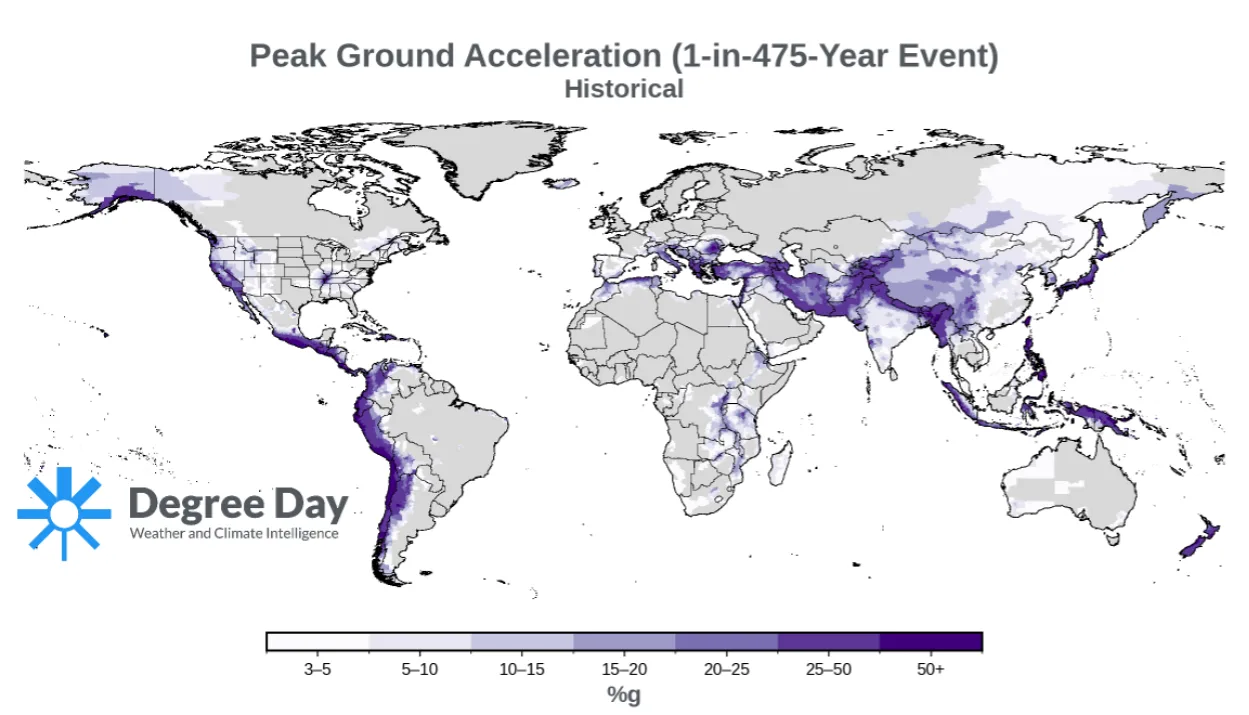
Highly relevant non-climate related hazards such as earthquakes are often excluded from ESG assessments, despite their importance for fully understanding business resilience to natural hazards.
Questions to ask
Before using climate-model data for hazard assessment, ask:
- Does the model directly simulate the hazard, or only a related climate variable?
- What additional hazard modeling is required?
- Are the relevant spatial and temporal scales represented?
- Are local infrastructure, terrain, defenses, and operating thresholds included?
- Are non-climate hazards also material to the decision?
Climate models are essential for understanding climate change. But many business-relevant hazards require additional modeling before they can be evaluated responsibly.
Myth #3: Higher-resolution data is always more accurate
High-resolution climate maps can be persuasive. They look local. They show detail. They often appear to distinguish one neighborhood, facility, or parcel from another.
But visual detail is not the same as accuracy.
A dataset can be spatially precise while still being wrong. It can show fine-scale variation that reflects historical geography, topography, or statistical interpolation without providing a more reliable estimate of future local climate change.
This is one of the most common sources of false confidence in ESG climate analytics.
Downscaling adds detail, but not always new physical information
Downscaling is used to translate coarse climate-model output into finer-scale data. It can be valuable, especially when it accounts for elevation, coastlines, land-surface features, and regional climate patterns.
But not all downscaling methods work the same way.
Statistical downscaling often combines coarse climate-model changes with high-resolution historical datasets. The result can look very local, but the future climate-change signal may still come from the coarse global model.
In other words, the map may show local texture, but the projected change may not be locally resolved in a physical sense.
This matters for decision-makers. A 1-kilometer climate dataset does not necessarily mean the model understands 1-kilometer climate processes. It may mean that coarse model changes have been mapped onto a finer historical baseline.
Regional climate models can help, but they are not magic
Regional climate models simulate the climate system at finer spatial resolution over a limited area. They can represent regional processes better than global models in many cases, including topography, coastlines, mesoscale circulation, and some forms of extreme precipitation.
This can add real physical value.
But regional climate models inherit uncertainty from the global models that drive them. They also have their own biases, parameterizations, and limitations. They may improve some variables while degrading others. They still require evaluation against observations, especially for the hazards and locations relevant to a decision.
Higher physical resolution is helpful only when it improves the representation of the processes that matter.

Regional Climate Models can add additional details using approaches that obey physical laws as opposed to statistical approximations that can smear out extremes important for risk assessments.
AI-generated climate fields require careful validation
New AI-based downscaling and climate-emulation tools can produce visually impressive high-resolution outputs. Some may eventually become useful. But the same principle applies: visual realism is not validation.
Before using AI-generated climate data for business decisions, users should ask whether the method has been benchmarked against observations, whether it preserves physically meaningful relationships among variables, whether it performs well for extremes, and whether its limitations are transparent.
A sharp-looking map is not enough.
Questions to ask
Before relying on high-resolution climate data, ask:
- What information actually drives the fine-scale pattern?
- Is the future change signal locally resolved or inherited from a coarse model?
- Has the dataset been validated against observations in the region?
- Does validation focus on the variables and extremes relevant to the decision?
- Does higher resolution improve the physical process being assessed?
Higher resolution can be useful. But it should be treated as a hypothesis to evaluate, not as proof of accuracy.
Myth #4: Climate indicators are estimates of risk
Climate indicators are not risk estimates.
A count of days above 90°F is not risk. A fire weather index is not wildfire loss. A drought index is not water shortage. A rainfall extreme is not flood damage.
These indicators describe environmental conditions. They can be useful for screening and comparison. But risk depends on what those conditions affect and how exposed, vulnerable, and adaptable the system is.
A hot day has different consequences for a warehouse, a hospital, a farmworker population, a data center, and an outdoor construction site. A one-foot flood has different consequences for a building with an elevated first floor than for one with basement electrical equipment. The same wind gust can produce minor disruption or catastrophic loss depending on building design, maintenance, roof condition, surrounding debris, backup systems, and emergency response.
Risk is not just hazard. It is hazard interacting with exposure, vulnerability, and adaptive capacity.
Hazard scores are useful for screening
This does not mean hazard indicators are useless. They can be very useful for early-stage screening.
They can help organizations identify:
- which assets may be exposed to heat, flood, wildfire, drought, wind, or coastal hazards;
- which regions deserve closer review;
- which facilities may face changing operating conditions;
- which hazards should be included in due diligence;
- where site-specific engineering or operational analysis may be needed.
At portfolio scale, this can be valuable. Screening helps organizations allocate attention.
The problem begins when screening metrics are treated as precise estimates of loss, asset value, insurance pricing, or investment suitability.
Financial risk requires additional assumptions
To estimate financial loss, an analyst must move beyond climate and hazard data. They must estimate how a specific asset responds to a specific stressor.
That requires information about building characteristics, operations, maintenance, protective systems, downtime sensitivity, insurance coverage, repair costs, supply chains, and human behavior.
Many of these details are not available in generic vendor models. They often reside with facility managers, engineers, operators, and local experts.
This is why property-level risk scores can be fragile. The climate data may be only one layer in a much longer chain of assumptions.
Compound and cascading risks are difficult to reduce to a score
Real disasters rarely unfold through one hazard acting alone.
A hurricane can produce wind damage, coastal flooding, inland rainfall, power outages, transportation disruption, supply chain delays, humid heat, and delayed recovery. A wildfire event can involve flame exposure, smoke, grid shutoffs, evacuation constraints, insurance disruption, and labor impacts. A heat wave can coincide with drought, wildfire smoke, water restrictions, and electricity demand peaks.
These compound and cascading effects often determine real-world impacts. But they are difficult to represent in a single risk score.
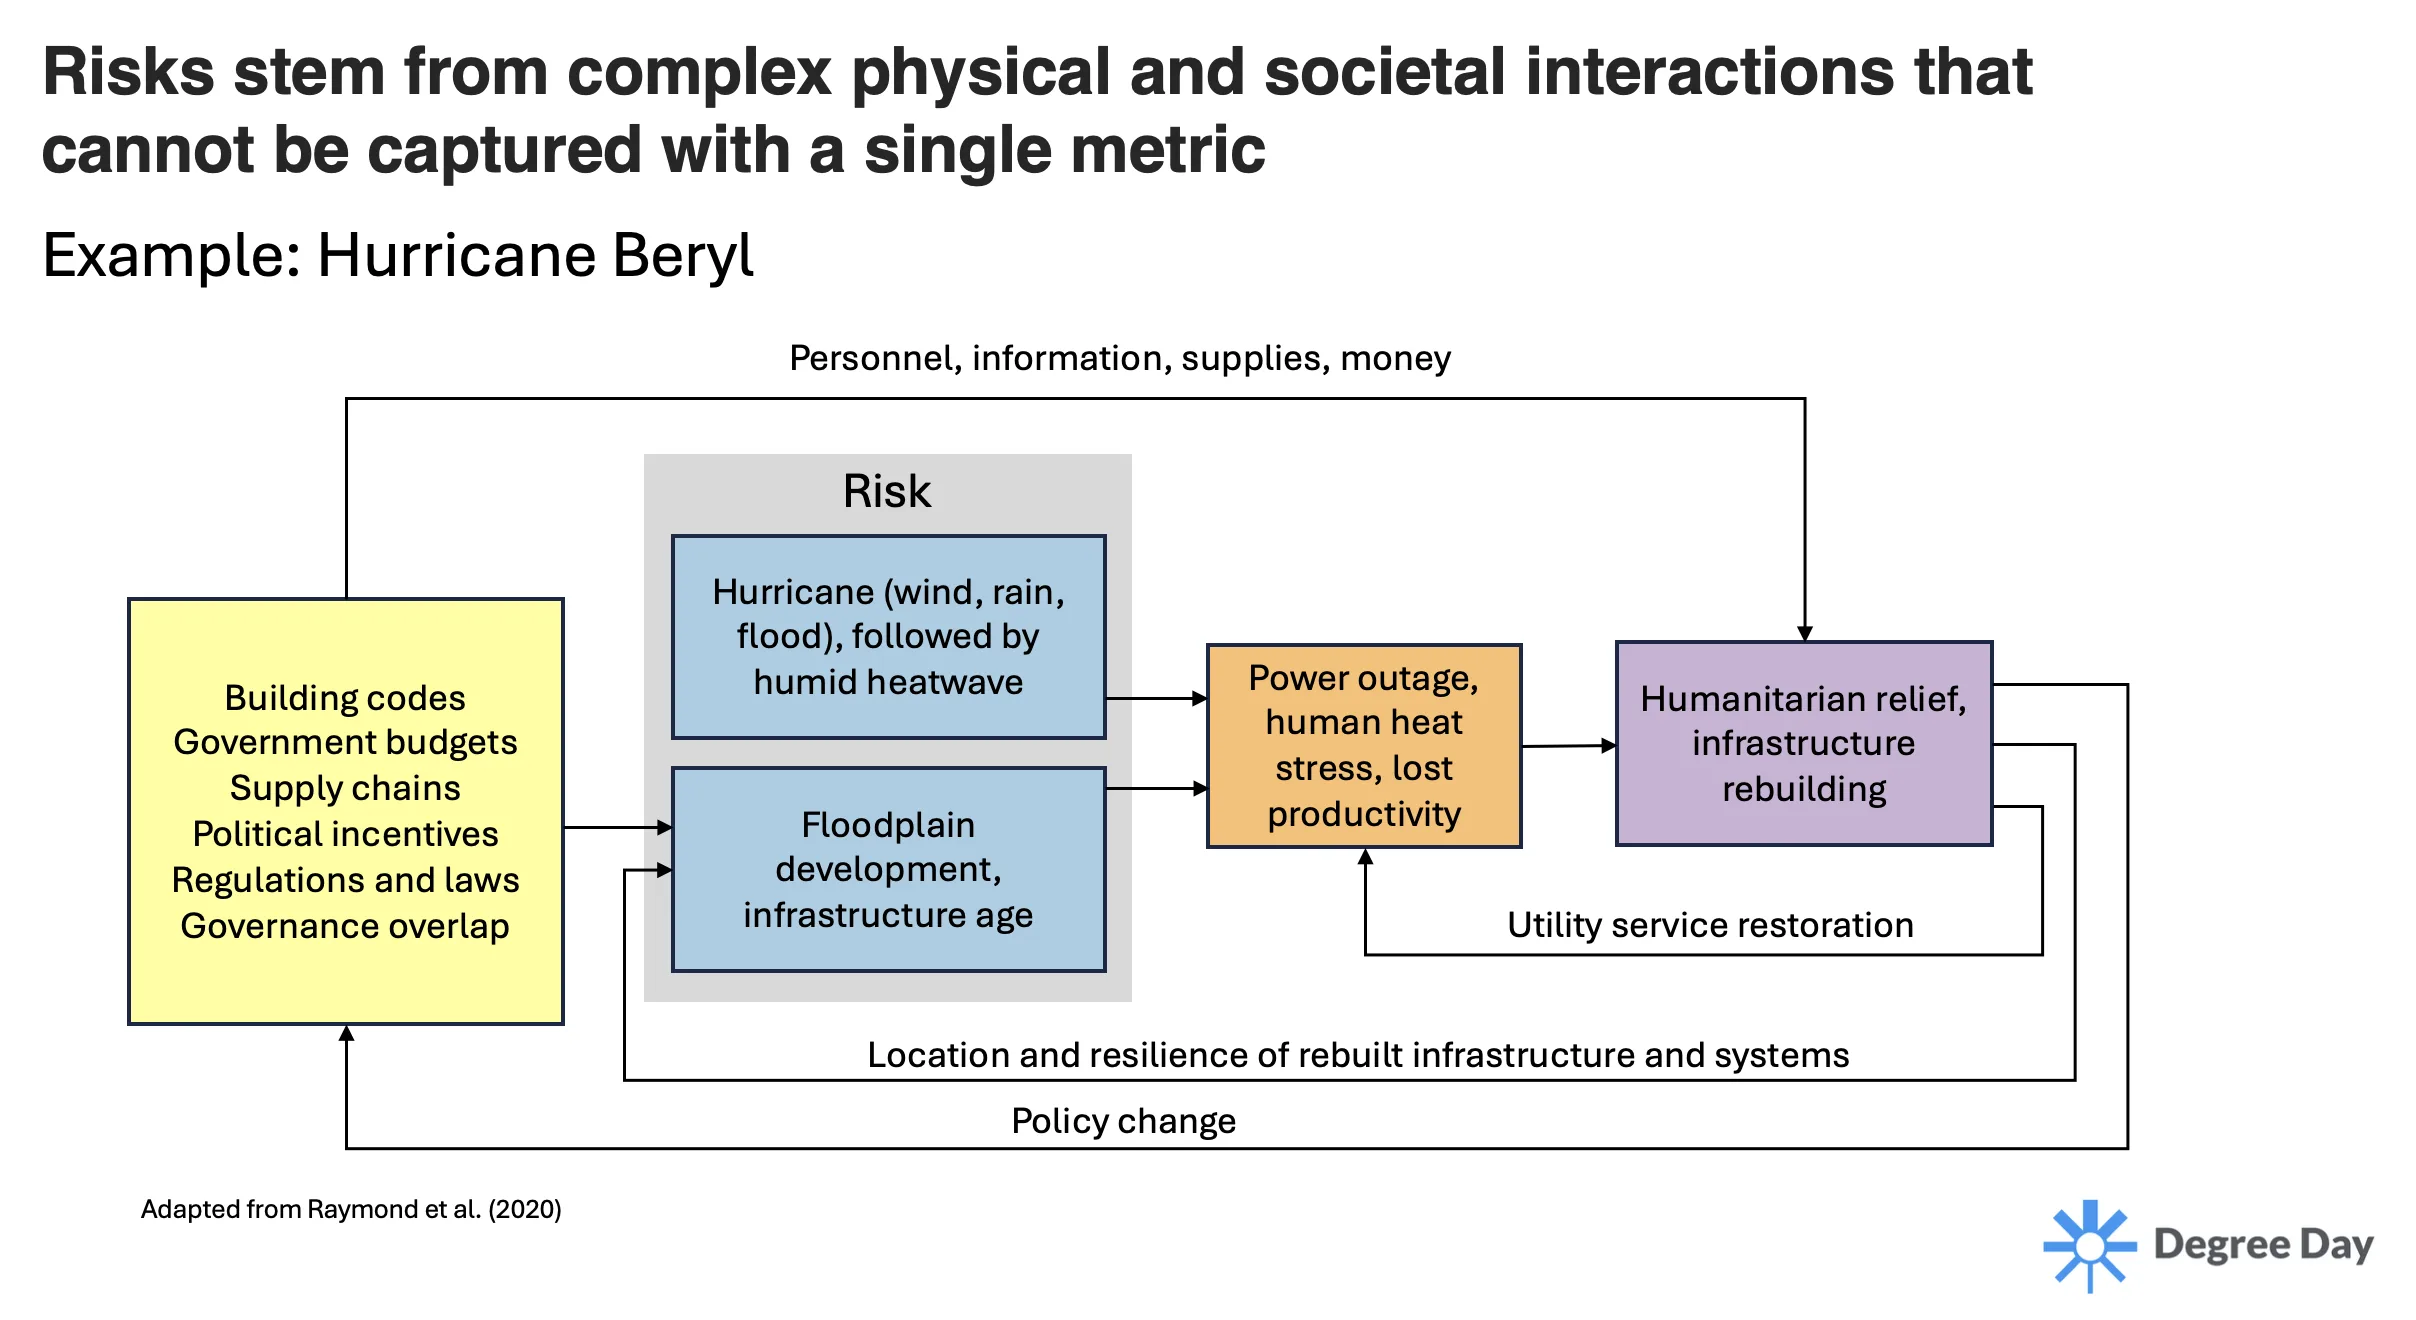
Impacts are more than the sum of hazard, exposure, and vulnerability. They arise from dynamic interactions across physical and social systems. Researchers refer to these as compound and cascading risks. These are challenging to incorporate in single risk ratings and scores.
For decision-making, a concrete stress-test storyline may be more useful than a generic score. Instead of asking, “What is the risk rating?” organizations should ask:
- What event would cause this system to fail?
- What threshold triggers shutdown?
- Which backup systems are most vulnerable?
- How long can operations continue without grid power?
- What happens if access roads are blocked?
- Which adaptation options remain useful under multiple plausible futures?
This is where climate science, hazard modeling, and operational knowledge need to come together.
Questions to ask
Before treating a climate indicator as risk, ask:
- Does this metric describe a hazard, an exposure, a vulnerability, or a financial consequence?
- What asset threshold does it relate to?
- What local information is needed to interpret it?
- Does the score account for existing protections, design standards, operations, and adaptive capacity?
- Would the decision change if the score were wrong?
Climate indicators can support risk assessment. They are not the same thing as risk.
What better climate data use looks like
The goal is not to reject climate data. The goal is to use it at the right level of confidence and for the right decision.
Better climate-data practice starts with the decision, not the dataset.
Before selecting a climate product, organizations should define:
- the decision being made;
- the asset or system being evaluated;
- the relevant hazard mechanism;
- the physical threshold that matters;
- the planning horizon;
- the tolerance for uncertainty;
- the available observations and local data;
- the consequences of being wrong.
For some decisions, a portfolio-scale screening tool may be sufficient. For others, especially high-stakes capital allocation or infrastructure design, generic climate risk scores are not enough.
A practical workflow often looks like this:
- Screen exposure. Identify which assets may be exposed to relevant hazards.
- Compare multiple lines of evidence. Use observations, historical events, climate projections, hazard models, engineering standards, and local knowledge.
- Evaluate model skill and relevance. Ask whether the data are accurate enough for the variable, location, hazard, and decision.
- Stress-test decisions. Explore how assets or operations perform under plausible extreme events, not just average projected changes.
- Prioritize robust actions. Favor no-regret, flexible, reversible, or adaptive measures when uncertainty is large.
- Use site-specific analysis for consequential decisions. For infrastructure siting, major capital investments, insurance strategy, or asset valuation, portfolio-level scores should trigger deeper due diligence, not replace it.
How Degree Day helps
Degree Day helps organizations use climate data responsibly.
We review vendor outputs, assess methodological assumptions, compare results against observations and engineering judgment, and clarify which conclusions are robust enough to support decisions.
For some questions, a portfolio-scale screening tool may be appropriate. For others, the right next step is a more detailed hazard analysis, site-specific review, design criterion, or decision-focused stress test.
The objective is not to produce false certainty. It is to separate defensible climate insights from model-dependent speculation.
Conclusion
Climate data can support better ESG reporting and better resilience planning. But it should not be mistaken for a crystal ball.
Bias correction does not eliminate model error. Climate models do not directly simulate every damaging hazard. Higher resolution does not guarantee accuracy. Climate indicators are not the same as risk.
Used thoughtfully, climate data helps organizations understand exposure, identify vulnerabilities, compare plausible futures, and make more resilient decisions. Used uncritically, it can create false precision and misplaced confidence.
The most useful question is not simply, “What does the model say?”
It is: what decision are we trying to make, what would we need to know to make it well, and can the available data actually support that decision?
