
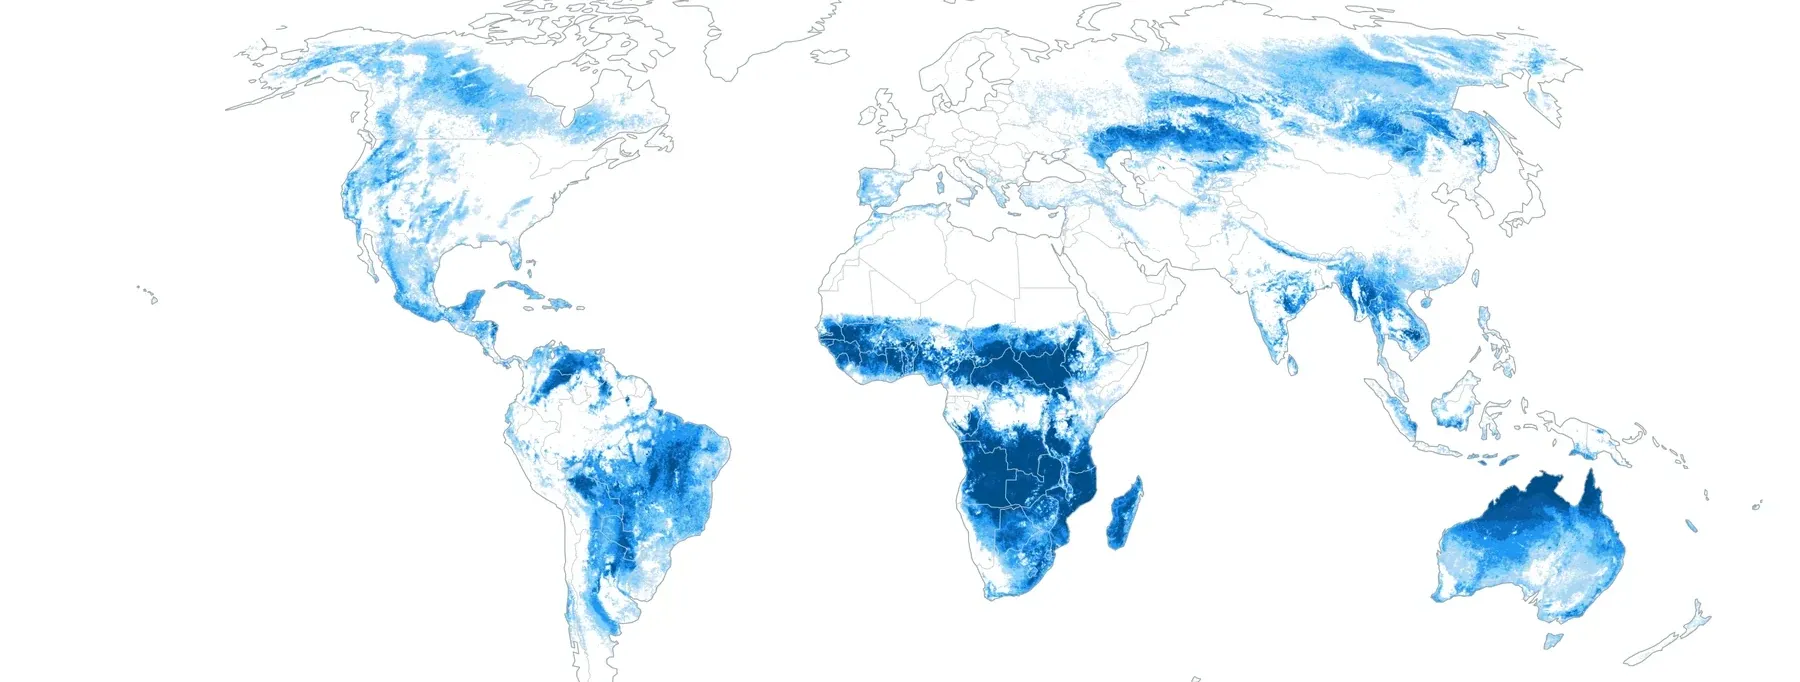
An Empirical Model of Global Wildfire Susceptibility
Introduction
Wildfire has become one of the most consequential and fastest-changing natural hazards worldwide. Rising temperatures, longer dry seasons, and the continued expansion of communities into flammable landscapes have increased both the frequency of destructive fires and the value of the property exposed to them1,2. The January 2025 fires in Los Angeles County, with property losses estimated between $28 billion and $54 billion, brought this shift into sharp focus and intensified interest in quantifying wildfire risk for insurance, lending, and climate-risk financial analysis3.
Several approaches to quantifying wildfire risk are in use by the hazard modeling industry. Physics-based fire-behavior models simulate ignition and spread across the landscape from detailed fuel, terrain, and weather inputs, often combined with large Monte Carlo simulations to estimate burn probability4,5,6. These methods can be highly detailed, as in the United States Forest Service’s Wildfire Risk to Communities7, but they require substantial computing resources and comprehensive local input data that are not available for much of the world. Statistical approaches, by contrast, learn patterns of fire directly from historical observations. A key advantage of an empirical model is that it is rooted in what has actually been observed to burn, so it is designed to reproduce observed fire behavior rather than to approximate it from first principles, and it can be applied consistently across regions, including those where the detailed inputs a physics-based model needs are unavailable.
Degree Day’s Global Wildfire Model takes an empirical, statistical approach designed for global coverage. It provides a consistent measure of wildfire susceptibility for every part of the world, including the many countries where detailed local fire models do not exist, so that locations and portfolios can be compared on a common basis. Its methodology is described here in plain language so that users can understand how it is built and what it can and cannot support.
Wildfire occurs across the globe, but its frequency, intensity, and consequences vary widely by landscape. Fires occur in forests, shrublands, grasslands, savannas, wetlands, and agricultural areas, each with very different fire regimes. A grassland may burn every few years and recover within a season, while a forest may burn only once every several decades but experience far greater ecological and economic damage. Therefore, a useful model must distinguish between the conditions that make land likely to burn, the frequency with which burning occurs, the intensity of an individual fire, and the consequences for exposed communities and assets.
Degree Day’s Global Wildfire Model addresses this problem using a statistical model trained on observed fires. The model learns the relationships between observed burning and its underlying drivers, including fire weather, climate, vegetation, terrain, and conditions associated with more opportunities for ignition.
The model produces a consistent global measure of wildfire susceptibility: the relative tendency of land to burn, based on its fire-conducive conditions (weather, climate, vegetation, terrain) and its opportunities for ignition. It is designed for regional comparison and portfolio-level screening, particularly in countries where detailed local wildfire models are unavailable.
The model does not forecast the precise location or timing of an ignition, simulate the path of an individual fire, or estimate the damage that a fire would cause.
Background
The global distribution of fire
The largest share of the world’s burned area is not found in forests. Tropical grasslands and savannas account for a disproportionately large share of the area burned globally each year, while forests account for a substantially smaller share.
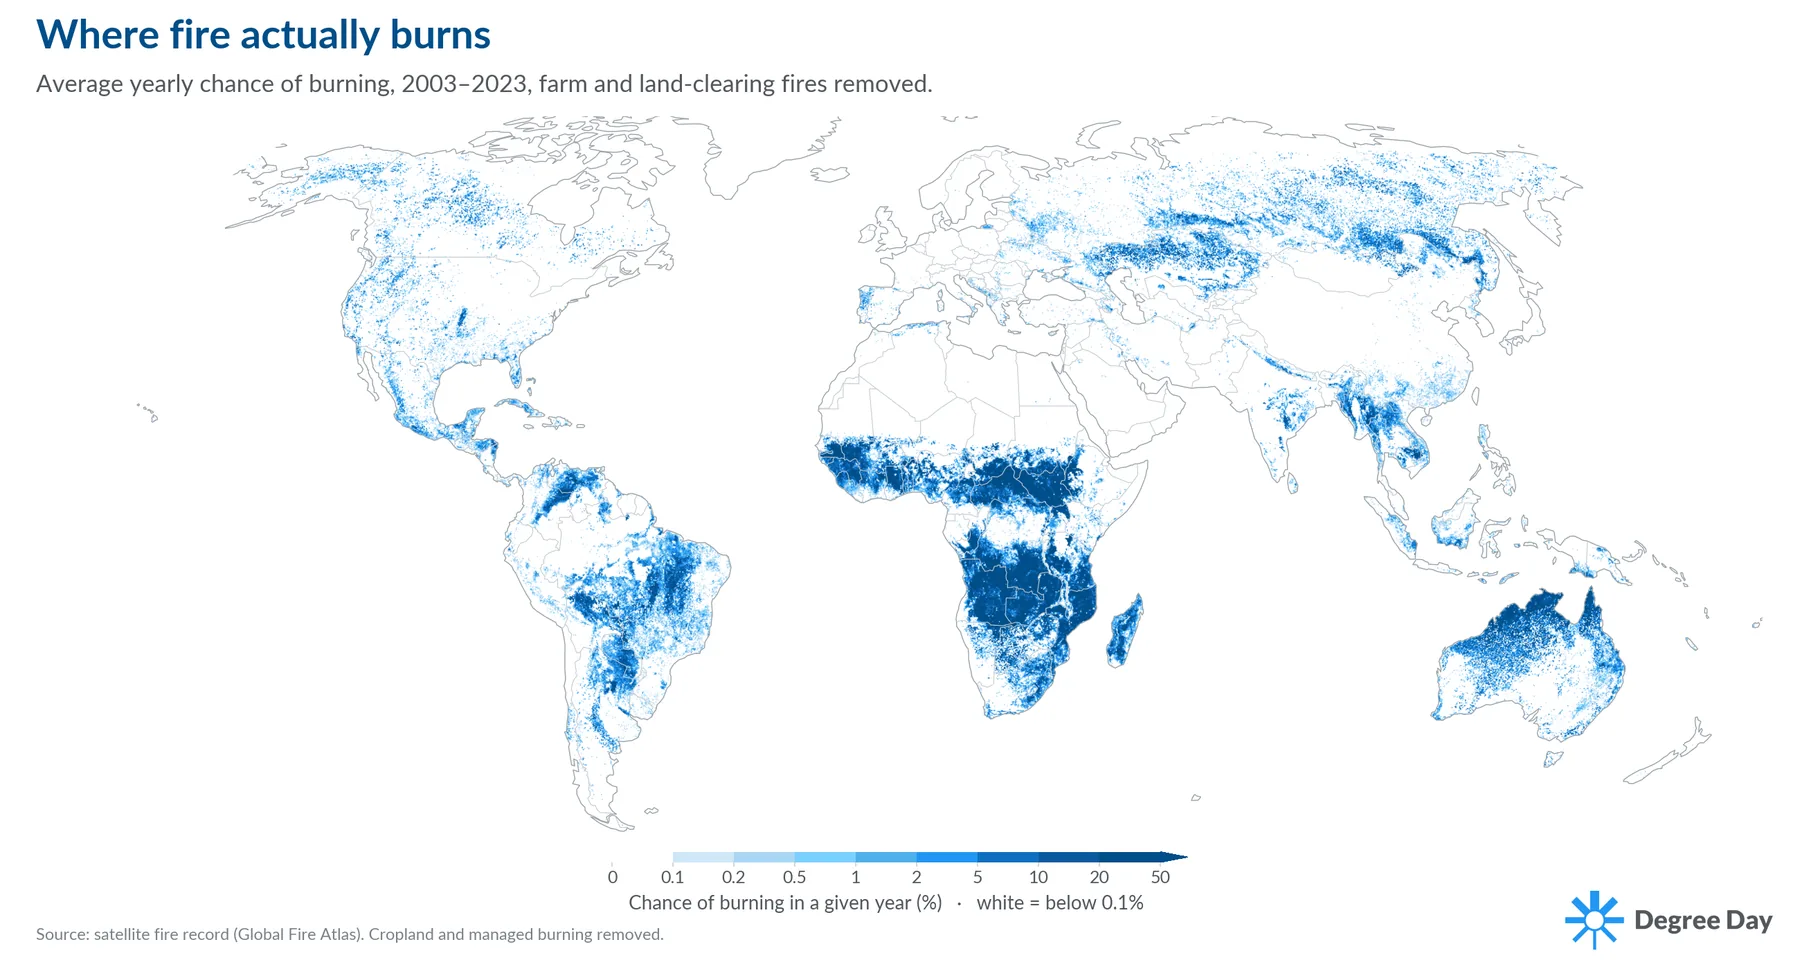
From these observations, Degree Day’s model produces a continuous global estimate of the tendency of land to burn, filling in the many fire-prone areas that the historical record shows only as scattered dots.
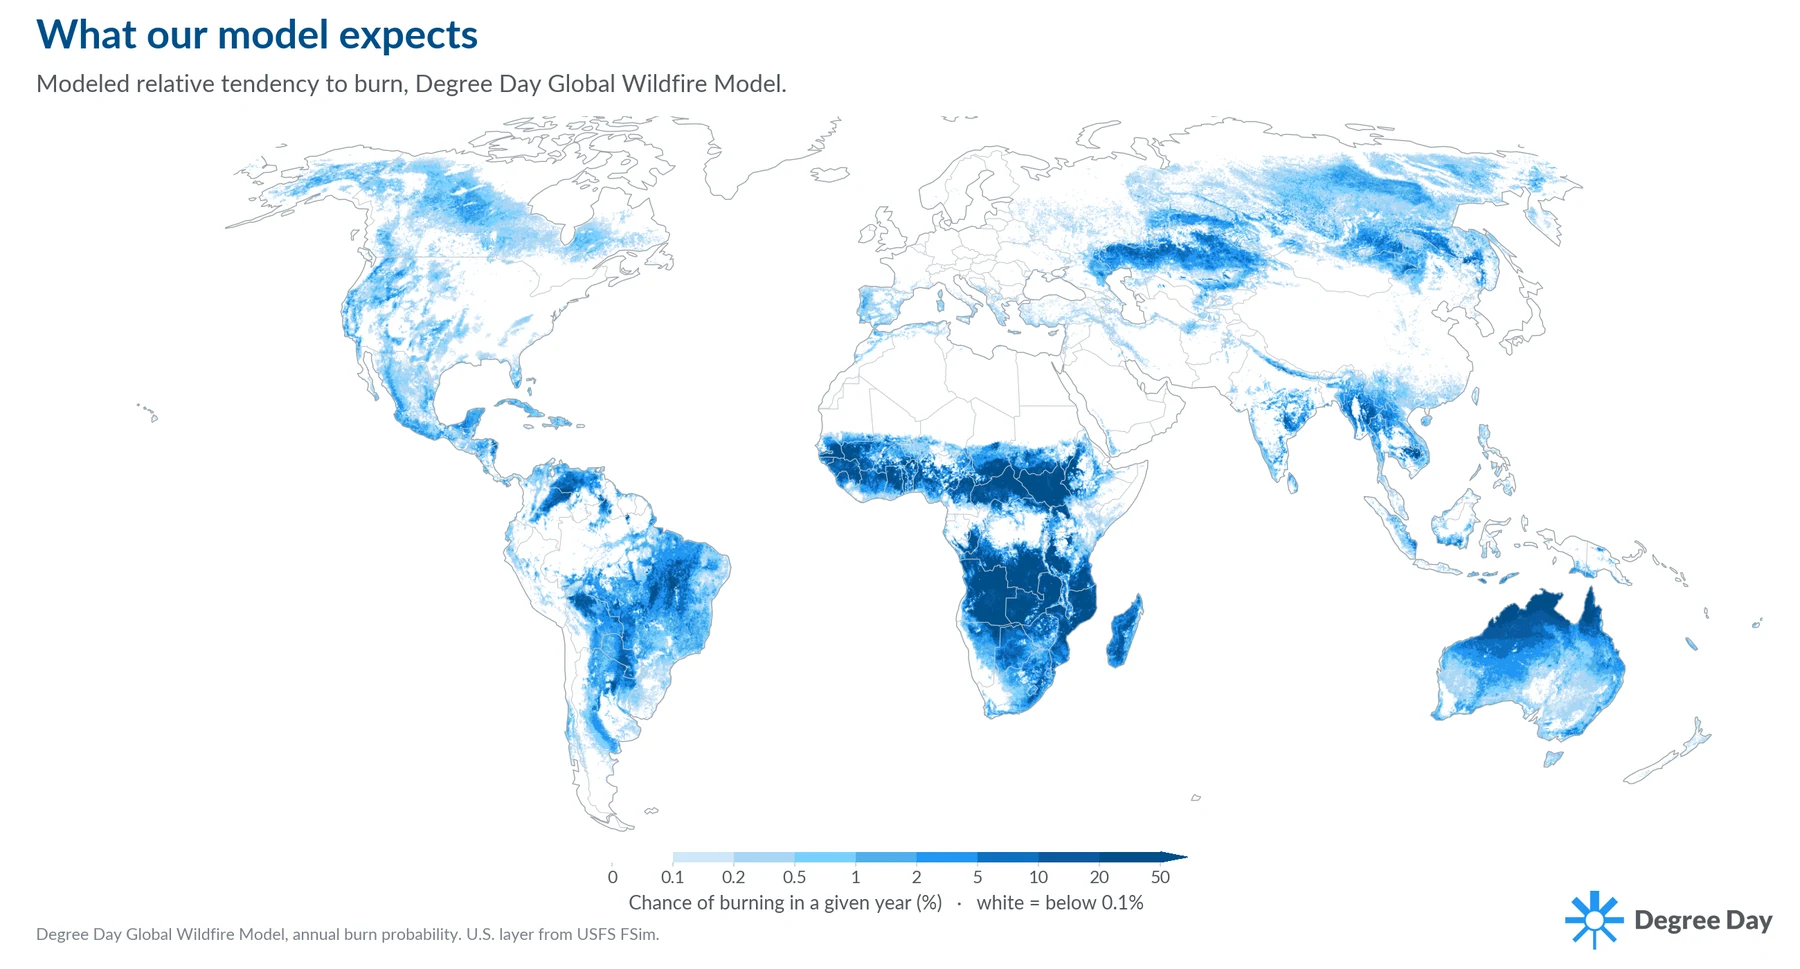
This pattern is important because the amount of land burned does not, by itself, describe the severity or consequences of fire. Grasslands can burn frequently, rapidly, and at relatively low intensity. In some regions, vegetation may recover within a single growing season. Forest fires may be much less frequent but release more energy, damage buildings and infrastructure, and alter ecosystems for decades.
Both landscapes may appear highly fire-prone, but they do not represent the same kind of risk.
Burn frequency, intensity, and consequences
Degree Day’s model estimates the relative tendency of land to burn. It does not estimate the intensity or destructive potential of an individual fire.
These concepts should be kept separate:
- Susceptibility, what this model estimates, describes the relative tendency of land to burn, combining the conditions that make it flammable with its opportunities for ignition.
- Fire intensity describes the energy released by a fire.
- Fire behavior describes how quickly and in what direction a fire spreads.
- Consequences describe the resulting effects on people, buildings, infrastructure, ecosystems, and economic activity.
- Risk combines the hazard with what is exposed and how vulnerable it is.
A location can have high burn frequency but relatively limited consequences. Another location can burn rarely but experience catastrophic losses when fire does occur. Degree Day’s model represents the first part of this chain: the underlying tendency of land to burn.
Not every observed fire is a wildfire
Satellite records detect burned land, but they do not always identify why it burned. A considerable share of global fire is deliberate. Examples include burning crop residue after harvest, managing pasture, clearing vegetation, and conducting prescribed burns to reduce fuel or achieve ecological objectives.
These fires may look similar to wildfires in satellite imagery. Both produce a visible burned area, and a satellite-derived record may not reliably distinguish between them. This creates an important modeling problem. If routine agricultural and prescribed burning were treated as uncontrolled wildfire, the model could learn patterns of land management instead of patterns of wildfire susceptibility. A farming district might appear highly susceptible simply because fields are burned on a regular seasonal schedule.
Degree Day therefore filters agricultural and prescribed burning from the historical record where it can be identified.
Vegetation, fire, and ignition
Fire depends on fuel, and fuel is largely composed of vegetation. Vegetation is also shaped by previous fire. Wet conditions may encourage grass growth, producing fuel that dries during the following fire season. A burned forest may develop a different vegetation structure and fire regime for decades. Repeated burning can help maintain grasslands and prevent tree cover from becoming established.
A flammable landscape also does not burn without a source of ignition. Lightning is an important natural cause of wildfire. Human-caused ignitions can result from electrical infrastructure, vehicles, equipment, escaped burns, campfires, or deliberate fire-setting.
Although broad patterns of where ignitions are more likely can be represented, the precise timing and location of an individual spark are inherently uncertain. For this reason, Degree Day’s product is best understood as a susceptibility model rather than an event forecast.
Methodology
Degree Day uses an empirical machine-learning framework to estimate global wildfire susceptibility. “Empirical” means that the model is built from observed fire activity rather than from theoretical rules alone. “Machine learning” means that a computer algorithm identifies statistical relationships between observed burning and the conditions associated with it.
The model asks:
What combinations of weather, climate, vegetation, terrain, and opportunities for ignition distinguish land that burns more often from land that burns less often?
Instead of specifying a universal set of fire rules by hand, Degree Day allows the model to learn these relationships from approximately two decades of observed burning. The resulting output is a comparative measure of wildfire susceptibility across the world.
Historical fire observations
The model is trained using observed burned area from 2003–2025, derived exclusively from the Global Fire Atlas (release v20260408). Observed burned area represents the land contained within mapped fire boundaries during the historical period. Locations that burned repeatedly or extensively have a stronger historical fire signal than locations with little or no recorded burning.
Other national, regional, and satellite fire datasets are kept separate from training and used to evaluate the model independently.
Data sources
| Dataset | Geographic role | Use |
|---|---|---|
| Global Fire Atlas | Global | Training record for observed burned area |
| Monitoring Trends in Burn Severity | United States | Independent comparison and validation |
| National Burned Area Composite | Canada | Independent comparison and validation |
| European Forest Fire Information System | Europe | Independent comparison and validation |
| FireCCI51 | Global | Independent satellite comparison and validation |
The Global Fire Atlas provides a consistent global record of individual fire perimeters and forms the sole observational target used to train the model.
The other datasets act as independent references. Because they are not used to fit the model, they provide a stronger test of whether the model reproduces fire patterns outside the dataset from which it learned.
No fire record is complete. Satellites can miss small, short-lived, cloud-obscured, or low-intensity fires. Government databases differ in the minimum fire size recorded and in the methods used to define fire boundaries. These uncertainties must be considered when the model is evaluated and interpreted.
Agricultural and prescribed-burn filtering
Degree Day filters the observed fire record to reduce the influence of agricultural and prescribed burning. The filter combines four signals: the dominant land cover a fire burned, how much of the surrounding area is cropland, whether a fire was set outside its location’s natural fire-weather season, and — decisively — whether the weather during the fire itself was extreme for that location. Fires that look like routine managed burning are removed; genuine wildfire, including human-caused wildfire, is kept.
The fourth signal matters because season alone is misleading. The most destructive fires in some regions burn in the climatological off-season: the January 2025 Los Angeles fires, the 2018 Camp Fire, and the 2017 Thomas Fire all ignited in months when local fire weather is normally quiet, driven instead by extreme offshore winds on the day. A seasonal rule alone discards exactly these events. Degree Day therefore keeps an off-season fire whenever the weather it burned in was extreme by that location’s own record, or whenever the fire was large and the weather at least elevated. Deliberate burns are conducted in benign conditions by definition, so they remain filtered out.
The purpose is not to remove every fire started by a person, since human-caused wildfires are genuine wildfires. The aim is to remove routine, deliberately managed burning, whose timing and location are set by people rather than by conditions, and which would otherwise teach the model patterns of land management instead of wildfire.
Filtering cannot be done perfectly at global scale, so some deliberate burning remains. The training target is therefore best described as predominantly wildfire rather than a completely pure record. The seasonal-timing rule has been validated against fires explicitly labelled as wildfire or prescribed in the United States8 and cross-checked against an independent global fire-type record9.
Technical detail: the filter stages
Each fire is first classified by its dominant land cover using the MODIS IGBP land-cover product10; fires in wildland classes (forest, shrubland, savanna, grassland) are kept, and those dominated by cropland, urban, water, or unclassified land are removed. A cropland-fraction layer built at roughly 3 km from the Copernicus Global Land Cover product11 then removes fires sitting in a majority-cropland matrix (more than half the surrounding area cultivated), catching the mixed farming landscapes the dominant-class label misses. Finally, each fire’s start month is placed on its own location’s monthly Fire Weather Index cycle, scaled from 0 (calmest fire-weather month) to 1 (peak); fires in the bottom fifth are removed as management-driven, which captures dormant-season prescribed burning in the southeastern United States and early-dry-season savanna management. Each fire’s own burning conditions are then checked against its location’s full daily fire-weather record: an off-season fire whose weather reached the top tenth for that location, or which burned more than 50 square kilometres in at least moderately extreme weather, is kept rather than filtered. Finally, fires matched to officially labelled prescribed burns in the United States8 are removed outright, since a recorded label is more reliable than any inference.
When tested against U.S. records that distinguish wildfires from prescribed burns, this chain mistakenly removes about 2% of actual wildfire area, down from about 4% for the seasonal rule alone, while removing prescribed burning at least as effectively. The fires recovered by the change include the Camp, Thomas, Glass, and January 2025 Los Angeles fires, all of which the seasonal rule alone had discarded.
Model inputs
After the fire record has been assembled and filtered, the model relates observed burning to five main groups of model inputs. Each input may help explain why one location burns more or less frequently than another.
| Input group | What it represents |
|---|---|
| Fire weather | Short-term conditions that dry vegetation and support ignition or fire spread |
| Climate | Long-term conditions that shape vegetation growth, seasonal dryness, and fuel availability |
| Fuel and vegetation | The amount and type of combustible material present |
| Terrain | Geographic characteristics that influence moisture, vegetation, and fire behavior |
| Opportunities for ignition | Broad indicators of where natural or human-caused ignitions may occur |
The specific datasets behind each input group are listed below. All are global, publicly documented sources, applied consistently worldwide so that the model’s inputs are comparable from one country to the next.
| Input group | Representative variables | Source datasets |
|---|---|---|
| Fire weather | Annual-maximum FWI, 90-day peak FWI, fire-season length | Fire Weather Index (Canadian Forest Fire Weather Index System) computed from ERA5-Land reanalysis |
| Climate | Mean annual temperature, temperature and precipitation seasonality, warm- and cold-quarter precipitation, vapor-pressure deficit, snow-cover days, growing-degree days, mean wind | CHELSA v2.1 bioclimatic normals, 1981–2010 |
| Fuel and vegetation | Aboveground biomass; land-cover fractions and fuel type | ESA CCI Biomass; Copernicus Global Land Cover (LC100) |
| Terrain | Elevation, slope, solar-radiation index | Global Ensemble Digital Terrain Model (GEDTM) |
| Opportunities for ignition | Population, road density, lightning frequency | Global Human Settlement population (GHS-POP); Global Roads Inventory Project (GRIP); World Wide Lightning Location Network (WWLLN) |
Inputs are drawn from long-term and multi-year averages rather than single years, so that the model represents the persistent conditions of a place rather than the weather of any one season.
Fire weather
Fire weather describes combinations of weather conditions that make vegetation easier to ignite and allow a fire to spread. The model considers how hot, dry, and windy the peak fire season becomes, how long the season lasts, how extreme the most dangerous conditions become, and whether those conditions persist for a sustained period.
A single hot day does not create the same conditions as a prolonged period of heat, low humidity, dry vegetation, and strong winds. Sustained extreme weather can progressively remove moisture from vegetation and create more opportunities for a fire to grow.
The model uses summaries of typical and extreme fire-season conditions. It does not issue a daily operational fire forecast.
Climate
Climate describes longer-term patterns that influence vegetation growth, fuel production, and seasonal drying. The model considers long-term temperature and rainfall, seasonal variation, atmospheric dryness, and the portion of the year warm enough for vegetation to grow.
Atmospheric dryness describes how strongly the air draws moisture from vegetation and soil. When the air is very dry, vegetation can lose moisture more rapidly and become easier to ignite.
The growing season also affects fuel availability. Vegetation must first grow before it can become fuel. A longer warm season may produce more vegetation, but that vegetation contributes to susceptibility only if it later becomes dry enough to burn.
Fuel and vegetation
Fuel is the combustible material available to a fire. It includes grasses, shrubs, leaves, branches, and trees. The model considers the amount and broad type of vegetation present, including forest, shrubland, grassland, wetland, cropland, and sparsely vegetated or bare land.
Different vegetation types support different fire regimes. Grass can grow quickly, dry rapidly, and support frequent fast-moving fires. Forests may burn less frequently but can support severe fires when weather and fuel conditions are suitable.
Fuel inputs help the model distinguish between locations that experience similar weather but contain very different quantities and types of combustible material.
Terrain
The model considers elevation, slope, and solar exposure. Elevation influences temperature, precipitation, snow cover, and vegetation. The direction a slope faces influences sunlight, surface temperature, and fuel moisture.
Steeper slopes can support more rapid uphill fire spread because heat from the fire preheats fuel above it.
These variables describe broad geographic influences. They do not simulate the movement of a specific fire across an individual hillside.
Opportunities for ignition
The model includes lightning as an indicator of natural ignition potential. It also includes population and road density as broad indicators of human activity and access.
Population and roads are proxies: measurable variables used to represent processes that cannot be observed consistently everywhere. Roads do not directly cause every fire, but places with more roads, vehicles, equipment, infrastructure, and human activity generally have more opportunities for ignition.
These inputs do not identify the cause of a particular fire. They represent broad geographic differences in the potential for an ignition to occur. It is therefore most accurate to say that the model predicts from environmental, landscape, and human-pressure conditions, rather than from physical conditions alone.
What the model estimates
The model puts a single number on that tendency to burn: roughly how much of a location burns in a typical year, expressed as a share of its area, or its average annual burned fraction. A value of one percent means that, on average, about one hundredth of the location’s area burns per year. Most of the world burns rarely, so this number is zero or very small across much of the map and rises only where conditions favor fire. The statistical method described below is chosen specifically for data of this shape, where the great majority of places show no fire and a minority burn again and again.
Machine-learning method
The model uses a machine-learning method called gradient-boosted decision trees. Here, a “tree” means a decision tree, a statistical structure used by the algorithm, not a tree or forest on the landscape.
A decision tree works by asking a sequence of relatively simple questions to divide observations into groups. For example, one decision tree might first separate dry locations from wet locations and then divide those groups further based on vegetation, temperature, terrain, or road density.
A single decision tree is usually too simple to represent global fire patterns. Gradient boosting therefore combines many decision trees, with each new one focusing on relationships the earlier ones did not explain well. The final estimate draws on all of them.
This approach is useful because wildfire relationships are often nonlinear. Higher temperatures may increase susceptibility where abundant dry vegetation provides fuel but have little effect where there is too little vegetation to burn. Additional rainfall may suppress fire in one region while promoting grass growth, and therefore future fuel, in another.
Gradient-boosted decision trees can learn these interactions without requiring the same relationship to apply in every ecosystem. The model identifies statistical patterns rather than physical laws, so its performance must be tested against observations that were not used to train it.
Excluding previous fire location as a predictor
A central design principle is that the model is not told where fire has previously occurred when it produces a prediction. Historical fire observations are used as the outcome the model learns to explain, but previous fire location is not included among the predictor variables.
Past fire is the answer used to train and evaluate the model, not an input used to generate the susceptibility map.
If previous fire locations were included as predictors, the model could achieve apparently strong results by assigning high susceptibility to places that had already burned. It would largely reproduce the historical record and might fail to identify susceptible land that had not burned recently.
By withholding previous fire location, Degree Day requires the model to explain observed burning through fire weather, climate, vegetation, terrain, and opportunities for ignition.
This does not make the model independent of history. It is still trained using historical observations, and missing or incorrectly classified fires can affect what it learns. The important distinction is that it cannot use a location’s previous fire record as a shortcut when estimating susceptibility.
Resolution and sharpening
The core model operates at a spatial resolution of approximately 11 km. This means that the relationships between fire and its inputs are learned across grid cells roughly 11 km wide. The exact ground area represented by a cell varies somewhat with geographic location and map projection, but the underlying model represents broad landscape patterns rather than individual parcels.
The final product is delivered on a 300 m grid. The broad model results are sharpened geographically using finer-resolution terrain and vegetation data, which reduces the artificial, block-like appearance of the original model grid.
The sharpening is designed to keep meaningful landscape boundaries, such as the transition between forest and sparsely vegetated land, rather than blurring across them.
The 300 m map should not be interpreted as if the entire model had been independently trained and tested at 300 m. This sharpening improves the geographic detail of the estimate, but it does not create the same amount of new information as a model developed directly at that resolution.
The delivered layer is therefore a sharpened representation of a model whose core scale is approximately 11 km. It is intended for regional comparison and portfolio screening rather than precise parcel-level analysis.
Exposure at the wildland-urban interface
Fire hazard does not stop at the edge of the vegetation. Wind-driven embers can ignite structures well ahead of a flame front, so communities set among or beside wildland fuels carry hazard that a purely vegetation-based estimate would miss. To represent this, the delivered layer includes a final post-processing step that extends wildland susceptibility into the neighboring wildland-urban interface, following the approach used by the United States Forest Service’s Wildfire Risk to Communities7.
The step uses a global wildland-urban interface map12 to identify interface areas. Susceptibility from adjacent wildland vegetation is spread into those interface pixels out to three kilometres, and each interface pixel is then assigned the higher of its own value and the spread-in value. The spread-in contribution tapers smoothly to nothing as it approaches that limit, so hazard fades back to the model’s own surface rather than stopping at an abrupt edge. Pixels away from the interface are left unchanged.
The delivered layer also extends one kilometre past the shoreline, so that structures built over water — piers, marinas, moorings, and overwater construction — receive the hazard of the shore they adjoin instead of no value at all. This raises modeled hazard in built-up areas that sit against fire-prone vegetation, where ember exposure is greatest, without altering the underlying wildland estimate. This step is an exposure-oriented overlay applied after the susceptibility model, not part of the modeled susceptibility itself: it changes only how hazard is carried into the built-up interface, not how any wildland location is rated. Where the two need to be kept separate, the layer without this overlay can be used.
Evaluation
Because the model learns from past fire, it is important to evaluate it on observations withheld from training. Degree Day does this in several ways: by hiding large geographic blocks, holding out whole continents, and training on earlier years to predict later ones. Across the United States, Europe, Australia, Canada, and Russia, the model separates fire-prone land from land that rarely burns and reproduces the broad geography of fire in each independent record, matching Canada’s government-mapped total to within about 1%. In the strongest test, previously unburned land that the model rated most susceptible went on to burn several times more often than average, with roughly half of all new fire falling in the top-ranked tenth.
The January 2025 Los Angeles fires were previously cited here as a forward-looking test, because they fell after the 2023 training cutoff. The training record now extends through 2025 and includes them, so that comparison is no longer independent and is not claimed as one. The forward-looking evidence quoted above comes from tests where the evaluation years are genuinely withheld.
A full, plain-language account of how the model is tested, with the regional comparison maps, the forward-looking skill tables, and the recent-fire case studies, is given in the companion article, Did our model see it coming?.
Discussion
Interpretation of the model output
Degree Day’s Global Wildfire Model provides a comparative assessment of the conditions associated with burning. A higher value indicates that a location has a combination of weather, climate, vegetation, terrain, and opportunities for ignition more commonly associated with observed fire. A lower value indicates that those conditions are less favorable relative to other fire-capable land.
The output is best interpreted as a ranking of susceptibility rather than as a deterministic prediction. A high rating does not guarantee that a fire will occur, and a low rating does not make fire impossible. Individual ignitions, unusual weather events, changes in vegetation, suppression activity, and other local conditions can all affect the outcome.
Frequency does not measure damage
The model measures the tendency of land to burn, not the consequences of burning. A frequently burned savanna and a rarely burned forest can receive similar susceptibility values even though their fires may differ greatly in intensity, duration, ecological effects, and potential property losses.
To assess risk, the hazard layer should be combined with information about exposed buildings and infrastructure, asset vulnerability, local fire intensity and behavior, access and evacuation conditions, suppression capacity, and potential ecological and economic consequences.
Regional variation in performance
Model strength varies by region. The global model performs most strongly across the major savanna and boreal fire belts. Performance is weaker in some regions with complex fire regimes or where detailed local alternatives are available.
In the United States, a purpose-built government fire simulation7 separates fire-prone from rarely-burnt land somewhat better than Degree Day’s global model, and earlier versions of this product substituted it over the contiguous United States. That substitution has been removed. The delivered layer is now one model everywhere on Earth.
The trade is deliberate and worth stating plainly. The substituted simulation scored better on United States interface land in Degree Day’s own testing. But it is a frozen present-day simulation: it cannot be projected forward, so no climate response could be offered over the United States while it was in use, and a portfolio spanning the United States and anywhere else was being scored by two different models with two different scales. A single global model restores like-for-like comparison everywhere and makes the forward-looking layer available in the United States for the first time. Users who prefer the government simulation for United States locations should use it directly, since it remains publicly available.
Spatial precision
The delivered 300 m layer is geographically sharper than the approximately 11 km core model, but the distinction between display resolution and predictive resolution is important. Users should compare patterns across broader areas rather than placing confidence in the precise value of an individual 300 m pixel.
Site-specific decisions should be supported by detailed local data and, where appropriate, a fire-behavior or engineering assessment.
Length of the historical record
The 2003–2025 fire record captures common and recurring fire regimes, but it is short relative to the recurrence period of rare extremes. A fire that occurs only once in many decades or once in a century may not appear in a 23-year record. The model therefore cannot fully characterize the rarest possible events.
Managed-burning uncertainty
The agricultural and prescribed-fire filter reduces the influence of managed burning but does not remove it completely. Some deliberate burning remains, especially where agricultural fire, prescribed burning, and uncontrolled wildfire occur in similar places and seasons. This can elevate modeled susceptibility in landscapes with frequent management burning.
The output should therefore be described as predominantly wildfire rather than an entirely uncontaminated wildfire record.
Ignition uncertainty
Population, roads, and lightning represent broad patterns of opportunities for ignition. They cannot forecast the exact source, location, or timing of an ignition. Changes in settlement, infrastructure, land management, suppression practices, or lightning could alter ignition patterns in ways not fully represented by the model.
Fire weather is changing
The model is trained on conditions observed between 2003 and 2025, but one of its main ingredients, fire weather, is not fixed in time. As fire seasons grow hotter, drier, longer, and more extreme, land can become more susceptible to burning even where its vegetation and terrain are unchanged. Degree Day tracks this by measuring the trend in fire-weather conditions over the past three decades. Across regions such as Southern California and the Mediterranean, most areas show fire danger rising. Because the delivered layer is now a single driver-based model everywhere, this forward-looking adjustment applies worldwide, including the United States.
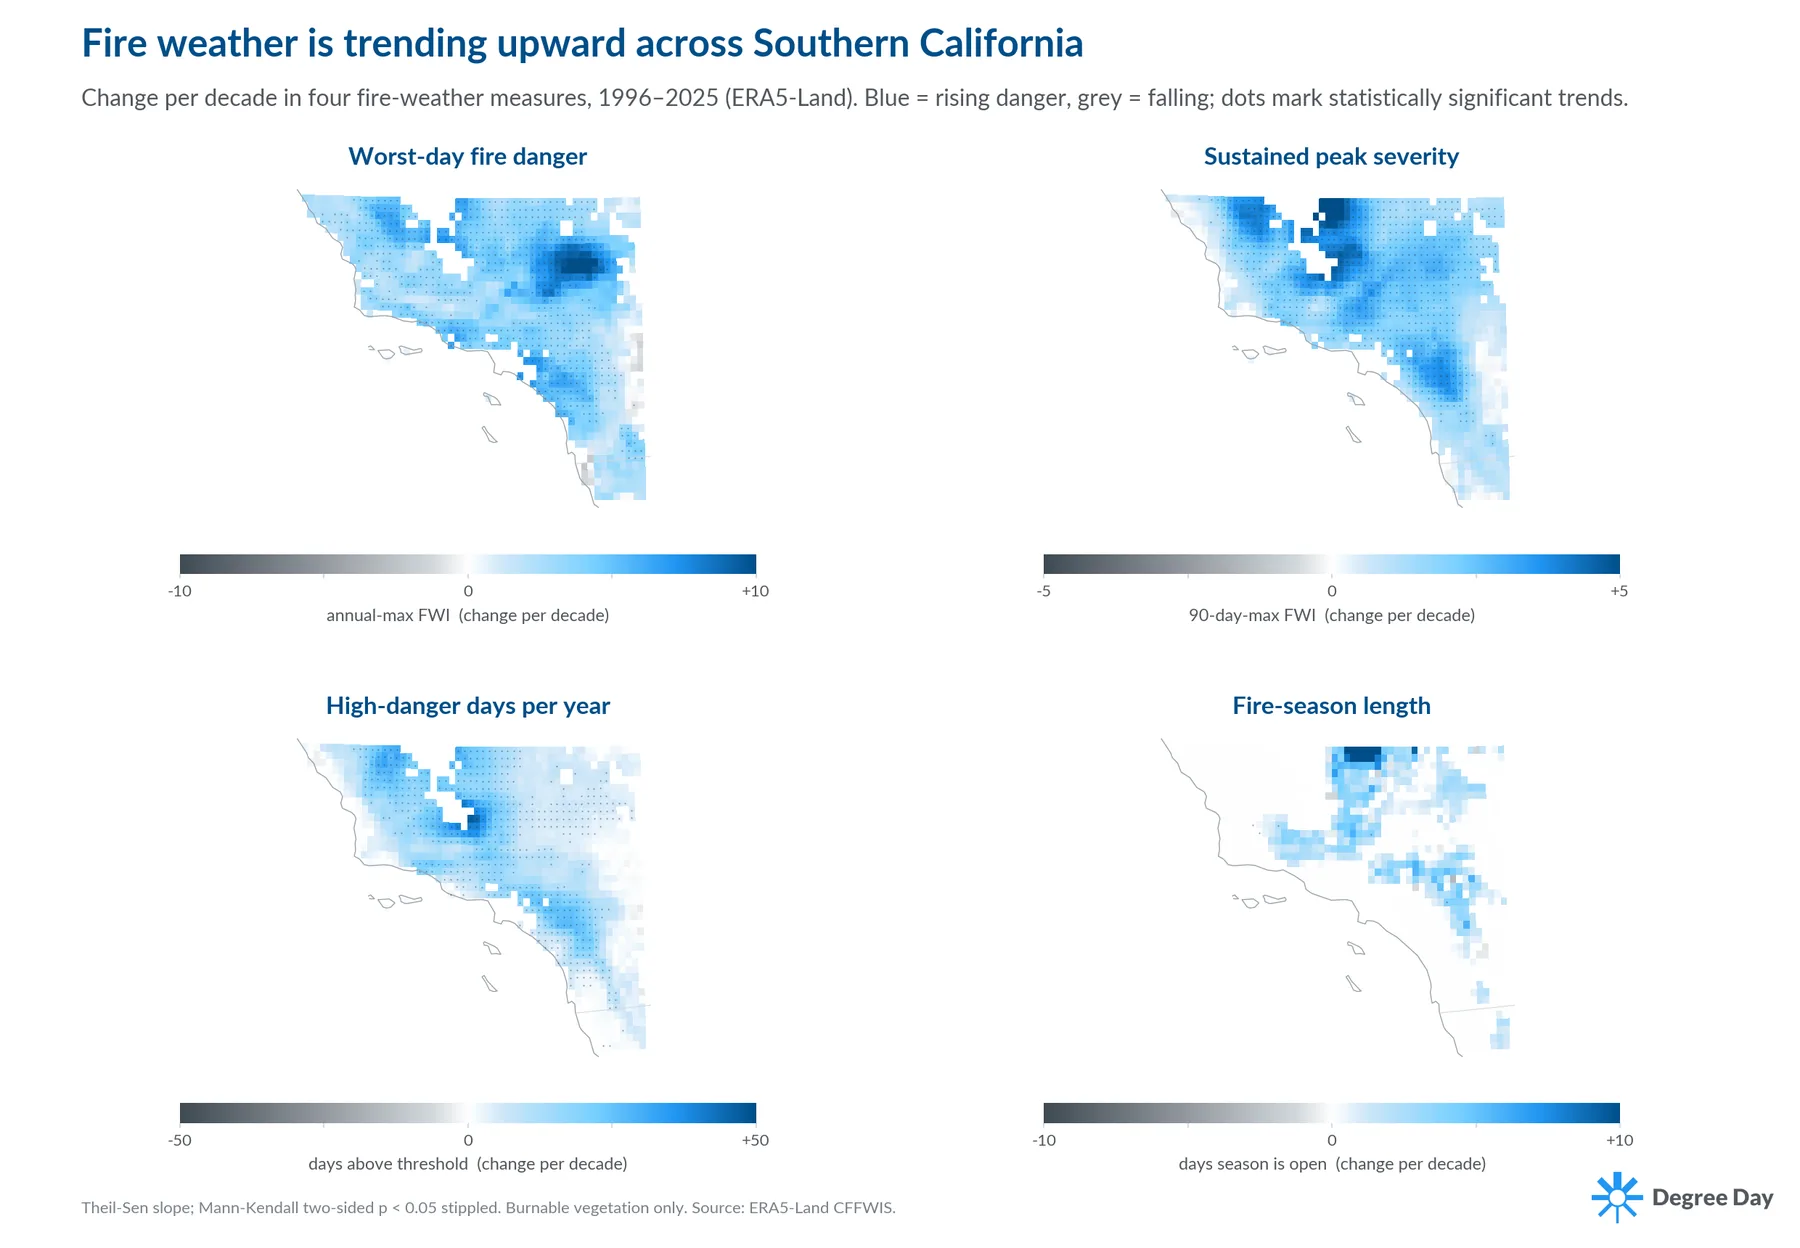
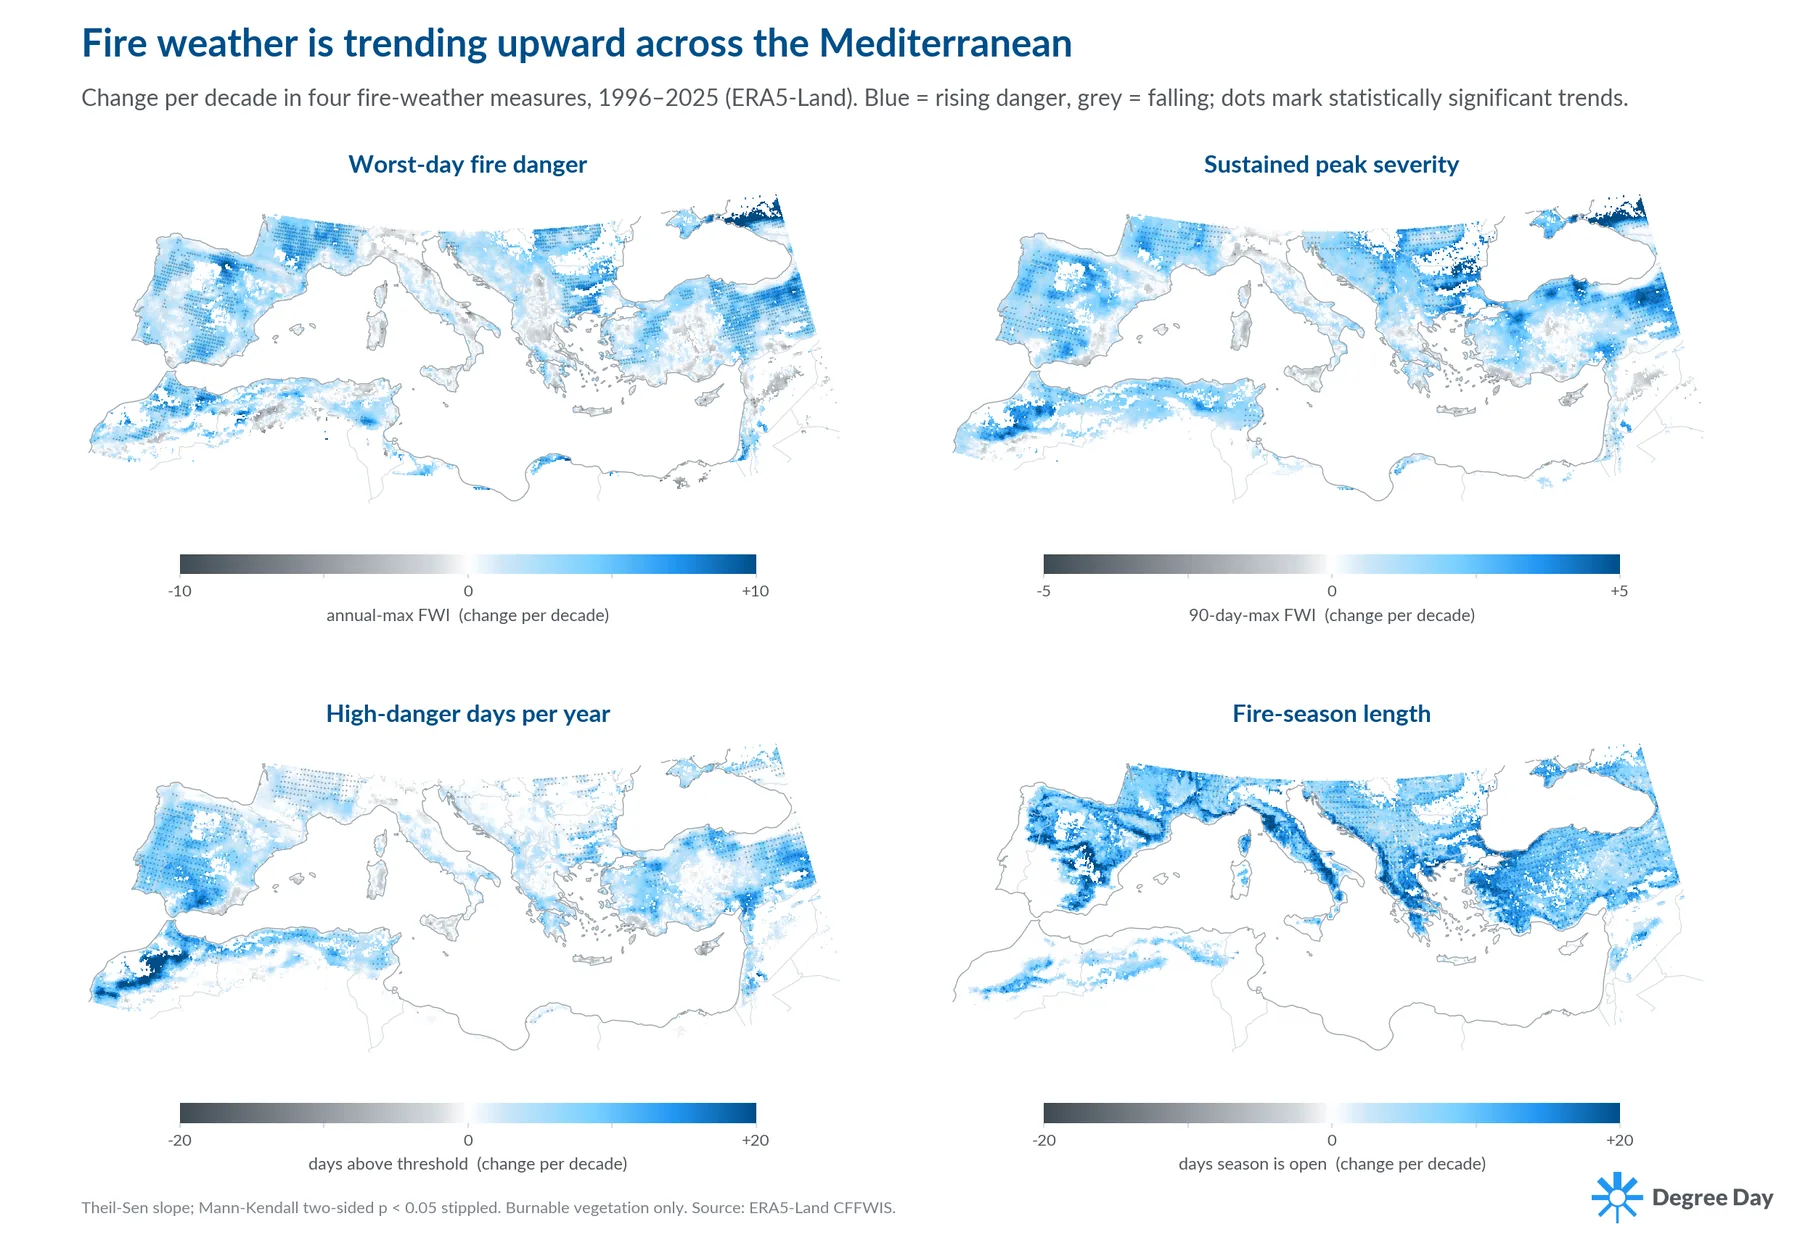
These maps show observed trends in weather, not the model’s susceptibility output and not a forecast of future fire. They matter because fire weather is one of the model’s inputs, so a shifting baseline shifts susceptibility over time.
It can be tempting to take projections straight from climate models and read off a map of future susceptibility. Climate models capture the big picture well, such as how much the whole planet warms13,14, but they are far less reliable about how temperature, humidity, wind, or rainfall will change at one particular place, where natural variability and gaps in the models add large uncertainty15,16. Several changes that matter for fire, including drying air over arid regions, shifts in the tropical Pacific, stronger European winter winds, and altered rainfall over the Americas, are ones current models have struggled to reproduce17,18,19,20,21. Projecting such things decades ahead for one location is therefore very uncertain.
For near-term planning, recent observations provide an important complement to climate-model projections, because they show how conditions have actually been changing at a location. They should not be pushed too far on their own. Degree Day uses both: recent trends to anchor the near term, and the spread across many climate models to bound the plausible futures, with any resulting susceptibility maps presented as scenarios rather than firm local forecasts.
Recommended Applications
Degree Day’s Global Wildfire Model is designed for screening and comparison at portfolio and regional scales. Appropriate applications include:
- Screening large portfolios of assets or locations.
- Identifying assets in areas of elevated wildfire susceptibility.
- Comparing sites within the same country or region.
- Prioritizing locations for more detailed investigation.
- Providing consistent coverage where suitable local fire models do not exist.
- Supporting investment, lending, insurance, infrastructure, and supply-chain assessments.
- Exploring how susceptibility may shift under changing fire weather, using recent observed trends as near-term proxies rather than decades-out climate-model projections.
The model is not intended to replace:
- A site-specific fire-behavior study.
- A parcel-level engineering assessment.
- A same-day operational fire forecast.
- An evacuation or emergency-response plan.
- A simulation of an individual fire’s spread.
- An estimate of fire intensity, damage, or financial loss.
Conclusion
Degree Day’s Global Wildfire Model provides a consistent empirical assessment of where environmental and human-pressure conditions are associated with more frequent burning.
Its central design principle is that previous fire location is used as an answer during training and evaluation, but not as a predictor. This requires the model to identify the conditions associated with fire rather than simply reproduce the historical fire record.
The model also filters agricultural and prescribed burning where these can be identified, uses independent fire data to evaluate performance, and tests whether highly ranked land goes on to burn after the period used to establish its earlier fire history.
The resulting map is not a prediction of individual fire events or their consequences. It is a comparative global measure of wildfire susceptibility.
Used within these boundaries, the model provides a transparent and defensible signal for identifying where wildfire conditions are elevated and where more detailed local analysis may be warranted.
