
Explore a location
Search the free explorer to review available historical and future climate design values.

Standard location-level values are free to explore. Project-specific analysis and support are available on request.
Climate
Models
Observation-informed, climate-adjusted, and transparently documented
Weather
Observations
Global models, reanalysis, and public datasets are valuable, but engineering design criteria are typically based on weather-station observations. Climate datasets often require additional processing before they can support design decisions.
Common gaps when used directly:
Engineering design references are typically grounded in weather station observations. In this Honolulu example, ERA5 and GMFD underestimate recent cooling degree days, while Degree Day closely matches the station-based value.
Explore observation-calibrated climate data worldwideWidely used datasets are valuable starting points, but each requires additional work before it can support forward-looking infrastructure design.
| Source / Tool | Future climate | Hourly | Weather station-calibrated | Tropical cyclone wind |
|---|---|---|---|---|
| CMIP6 | ✓ | |||
| LOCA2 | ✓ | |||
| NEX-GDDP | ✓ | |||
| ERA5 | ✓ | ✓ | ||
| NOAA Atlas 14 | ✓ | ✓ | ||
| ASHRAE | ✓ | ✓ | ||
| ASCE Hazard Tool | ✓ | ✓ | ||
| Degree Day | ✓ | ✓ | ✓ | ✓ |
Degree Day develops location-specific climate design values that help teams evaluate future conditions, compare assumptions, and identify where project-specific review may be needed.
Standard outputs are available through the free explorer as clear tables and figures. Degree Day can also provide customized datasets, interpretation, and documentation for design narratives, technical memoranda, due diligence, and internal review.
Typical outputs include:
Additional variables, including solar radiation and climate zones, are also available.
Explorer results include information on data sources, methods, and uncertainty. More detailed documentation is available for project-specific analyses.
Explore climate design conditions for locations worldwide at no cost. Switch units, compare global warming levels, and view either absolute values or changes from baseline.
Loading design conditions…
Sample station shown for demonstration. Global warming levels are defined relative to 1850–1900. Hover over any column heading, field label, or value for a full description. Future warming levels also include the 5th–95th percentile ensemble range.
Degree Day develops climatic design conditions from quality-controlled weather-station observations, solar radiation datasets, precipitation climatologies, and climate model projections.
Historical weather-station records are extensively screened to remove outliers, erroneous values, reporting artifacts, and other non-climatic issues. Design criteria are calculated only when enough valid data are available to support a stable estimate; the required data coverage varies by variable and metric.
Solar radiation values are derived from the National Solar Radiation Database. Precipitation inputs are based on high-resolution, bias-adjusted gridded climatologies of monthly and annual precipitation totals. Weather-station observations are drawn from multiple networks around the world to support broad geographic coverage.
Future climate adjustments are developed from CMIP6 and CORDEX model ensembles. Model outputs are bias-adjusted using quantile delta mapping at the day-of-year level with a sliding 21-year window. Daily projections are then downscaled to hourly conditions using a historical analog method, preserving realistic relationships among temperature, humidity, wind, solar radiation, and other design variables.
Results are presented as climatic design values with documented data sources, assumptions, methods, and model ranges.
Review the public methodology and model evaluation, or contact Degree Day for project-specific documentation and support.
Explore climate-adjusted rainfall IDF values at no cost. Hover over any point to read exact values, switch between intensity and depth, compare units, and view results by global warming level or change from baseline.
Loading IDF curves…
Global warming levels are defined relative to 1850–1900. Hover over any point to read the exact value. For future warming levels, values also include a 5th–95th percentile range.
Degree Day generates climate-adjusted IDF curves for both weather-station locations and off-station project sites.
At weather stations, precipitation records are extensively quality controlled to remove erroneous values, reporting artifacts, and other non-climatic issues. Cleaned station records are then used to estimate extreme rainfall statistics, including how rainfall extremes vary with climate conditions.
For off-station locations, Degree Day uses a machine-learning model trained on station observations and bias-corrected hourly output from high-resolution convection-resolving simulations across multiple regions of the world. This supports IDF estimates at project sites where long-term, high-quality station observations are limited or unavailable.
Future rainfall adjustments are informed by CMIP6 and CORDEX ensembles and translated into project-relevant scenarios, time horizons, or global warming levels. Results are presented as climate-adjusted IDF curves with documented data sources, assumptions, statistical methods, and model ranges.
Public methodology and model-evaluation information are available, with more detailed project documentation available on request.
Our method is benchmarked against a global network of weather-station observations and documented in the peer-reviewed literature — not a black box.
Share of evaluated weather stations where Degree Day reduced RMSE relative to raw ERA5.
Source: Rasmussen (2026), “Multivariate bias correction of ERA5 using in-situ observations for planning and engineering,” Environmental Research: Climate.

Built design-value datasets at WSP and Arup, worked at NOAA, and authored the peer-reviewed bias-correction method this service runs on.
More about the teamExplore rainfall IDF curves, HVAC design conditions, degree days, and extreme wind values for locations worldwide through the public explorer.
Compare baseline values with standard global warming levels through the explorer. Degree Day can also develop custom scenarios and time horizons aligned with an asset's service life or investment period.
Review the sources, assumptions, and model ranges behind the standard values. Project-specific analyses include additional documentation tailored to the intended decision.
Engage Degree Day for recommended criteria, customized tables and figures, spreadsheet delivery, technical memoranda, due diligence, and engineering review support.
Search the free explorer to review available historical and future climate design values.
Compare the standard results with your project assumptions, applicable standards, design life, and tolerance for exceedance.
Degree Day can recommend appropriate criteria, customize the analysis, prepare technical documentation, and support reviewer or stakeholder questions.
Standard location-level values can be explored at no cost through the web application.
Project-specific interpretation, custom methods, bulk data access, portfolio analyses, documentation, and technical support are scoped according to the work required.
Discuss Project Support
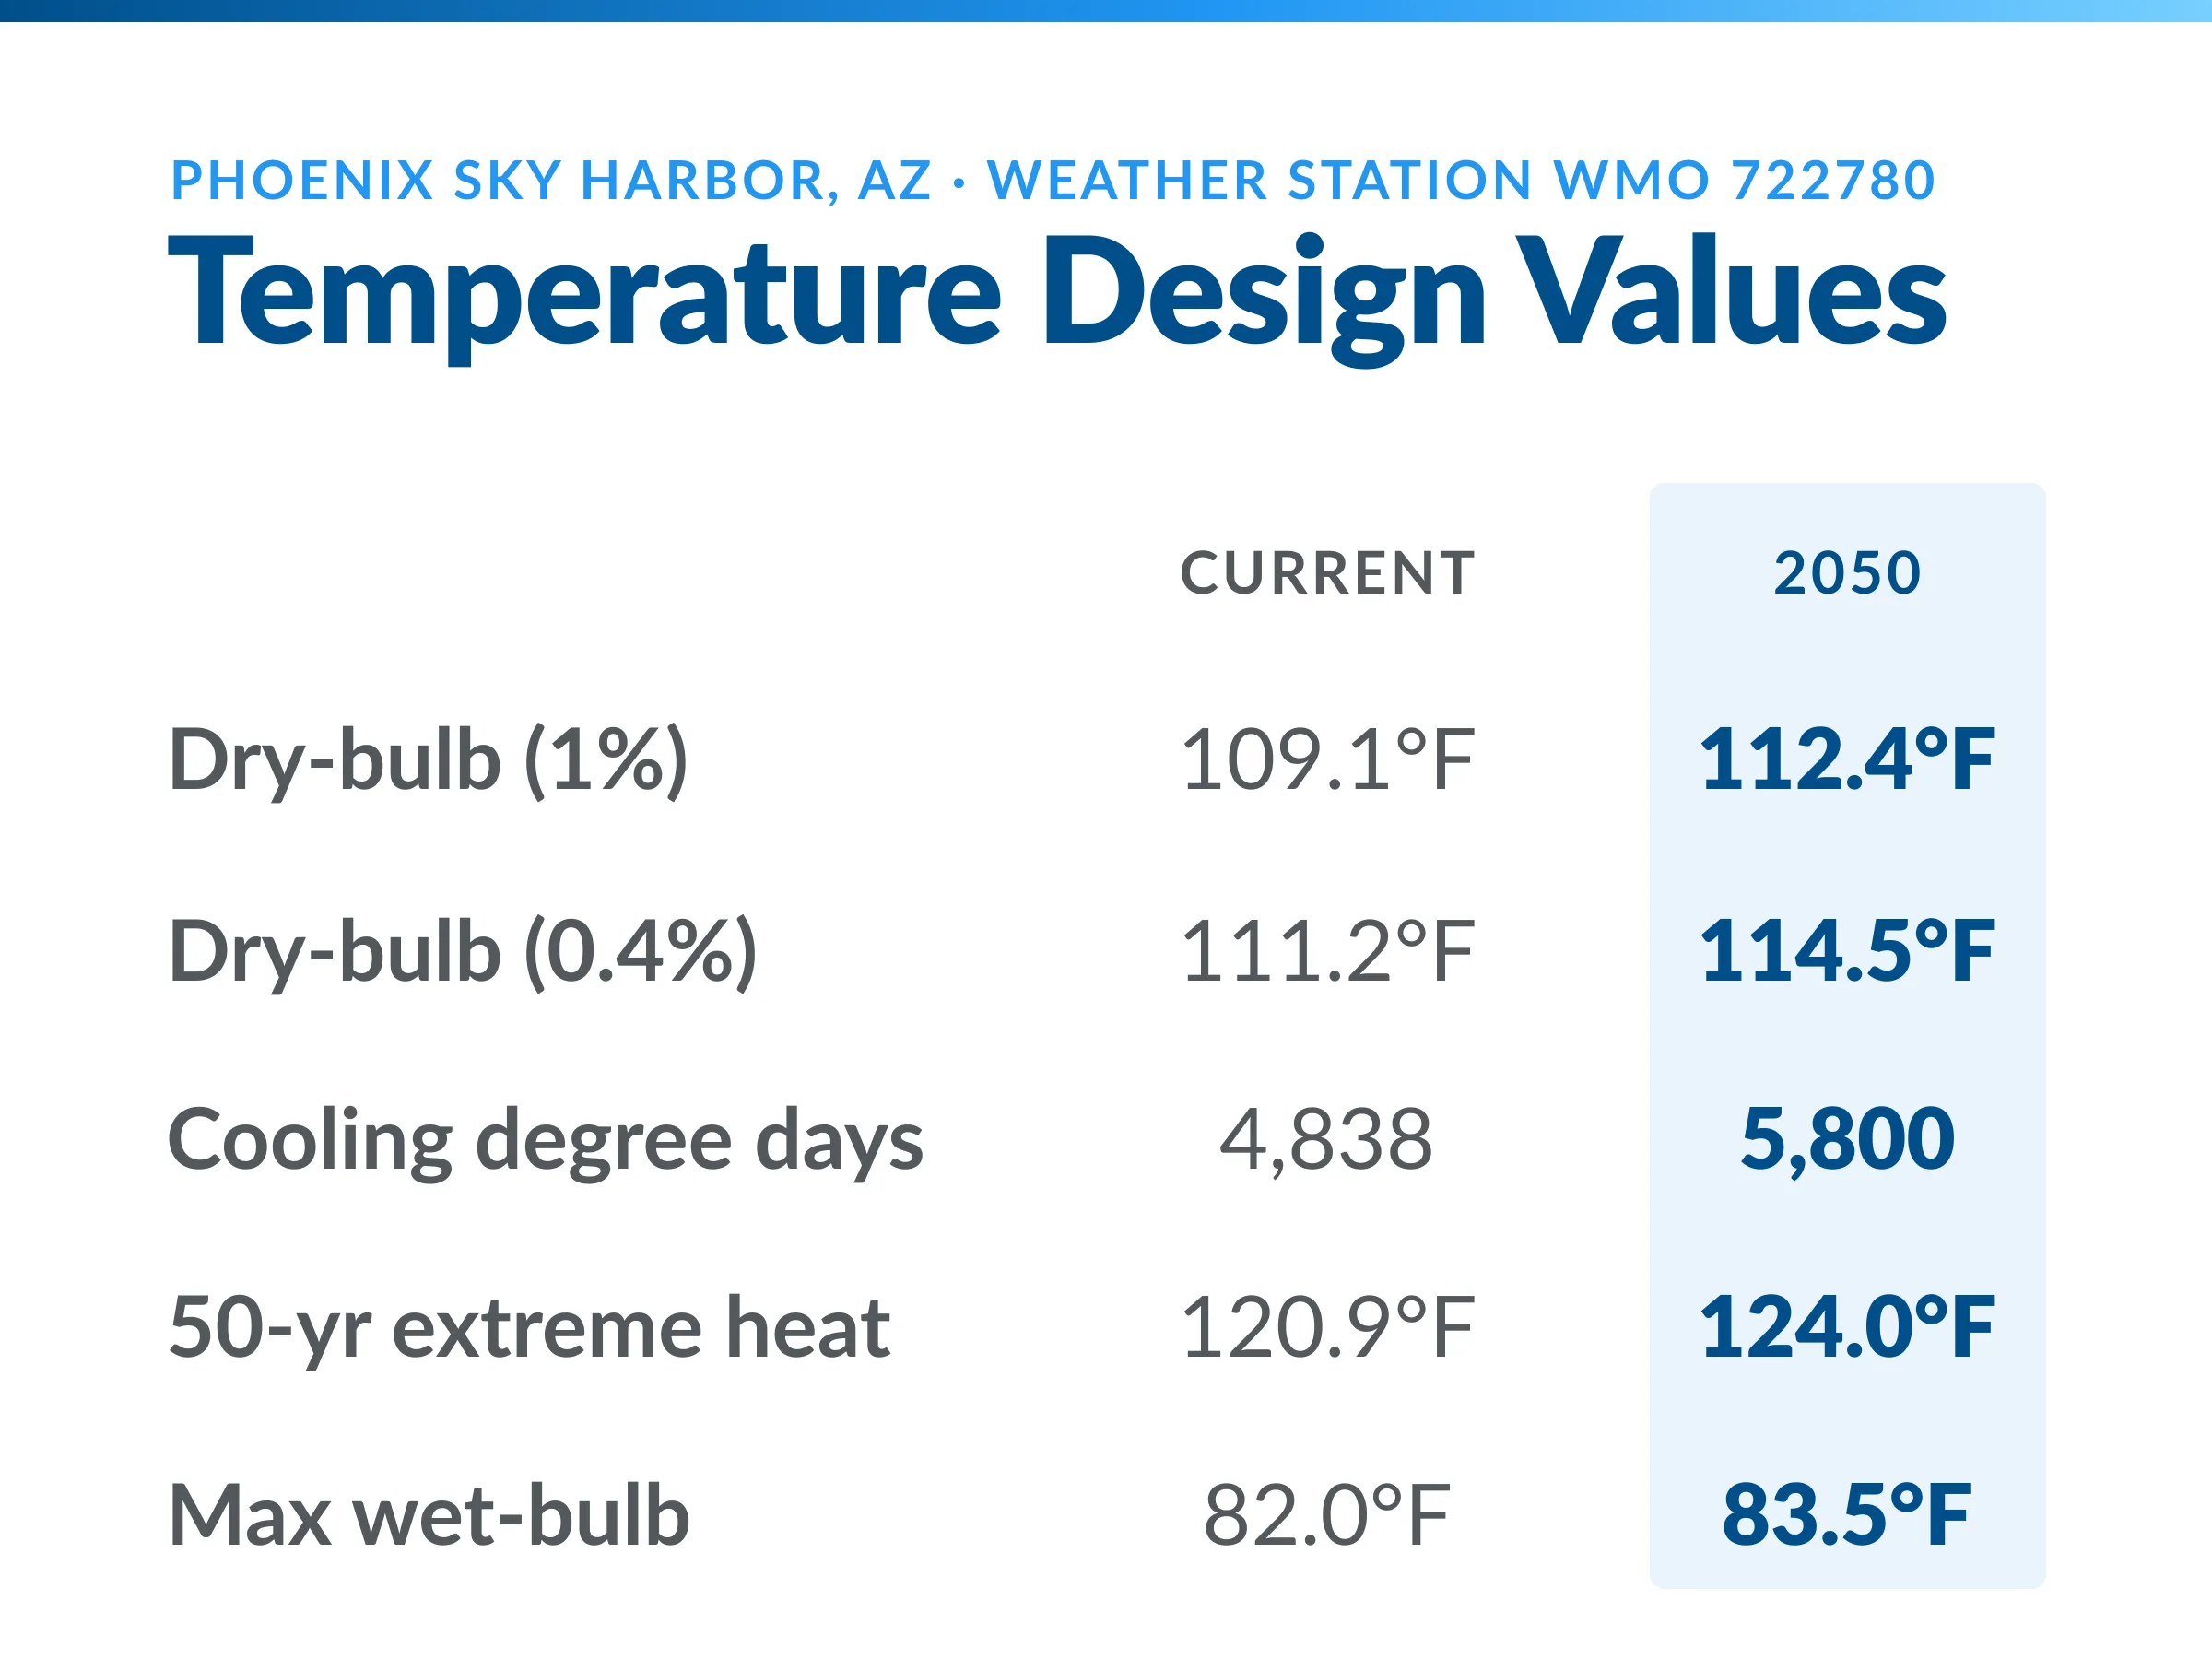
Climatic design temperatures and humidity extremes for evaluating HVAC sizing, equipment selection, and future performance.

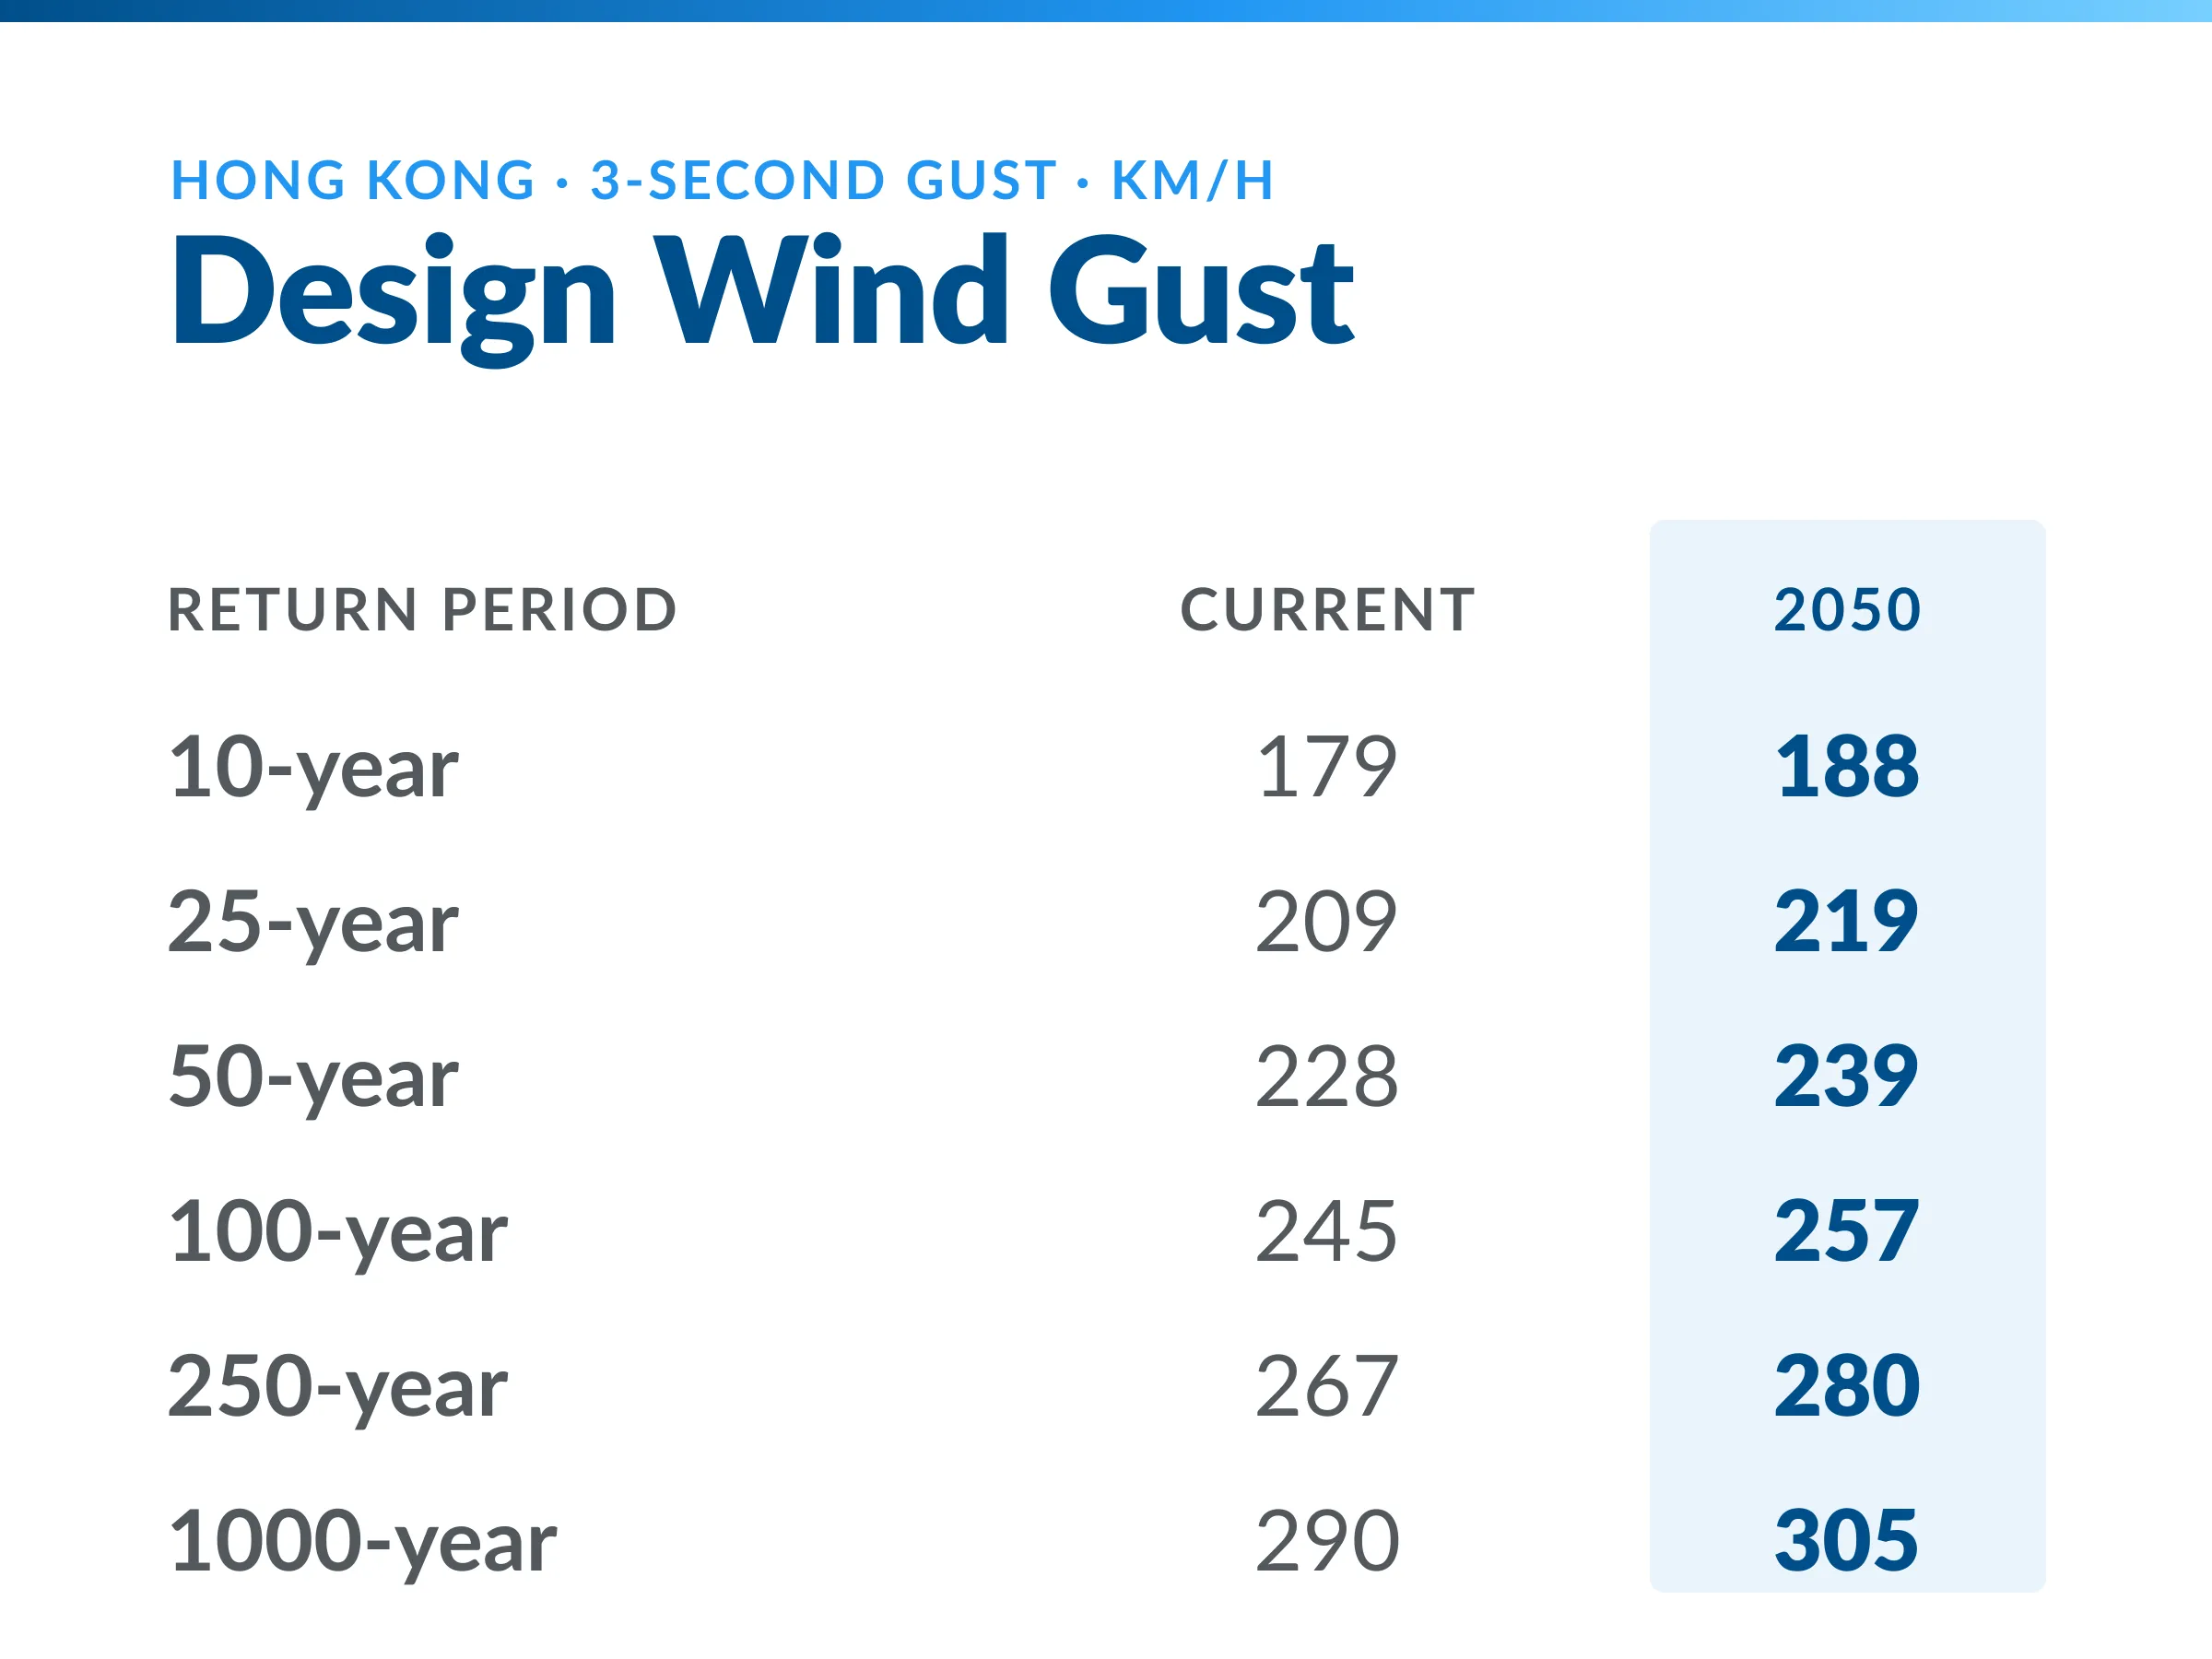
Wind-speed return periods and future-change estimates for comparison with code assumptions, resilience assessment, and engineering review.

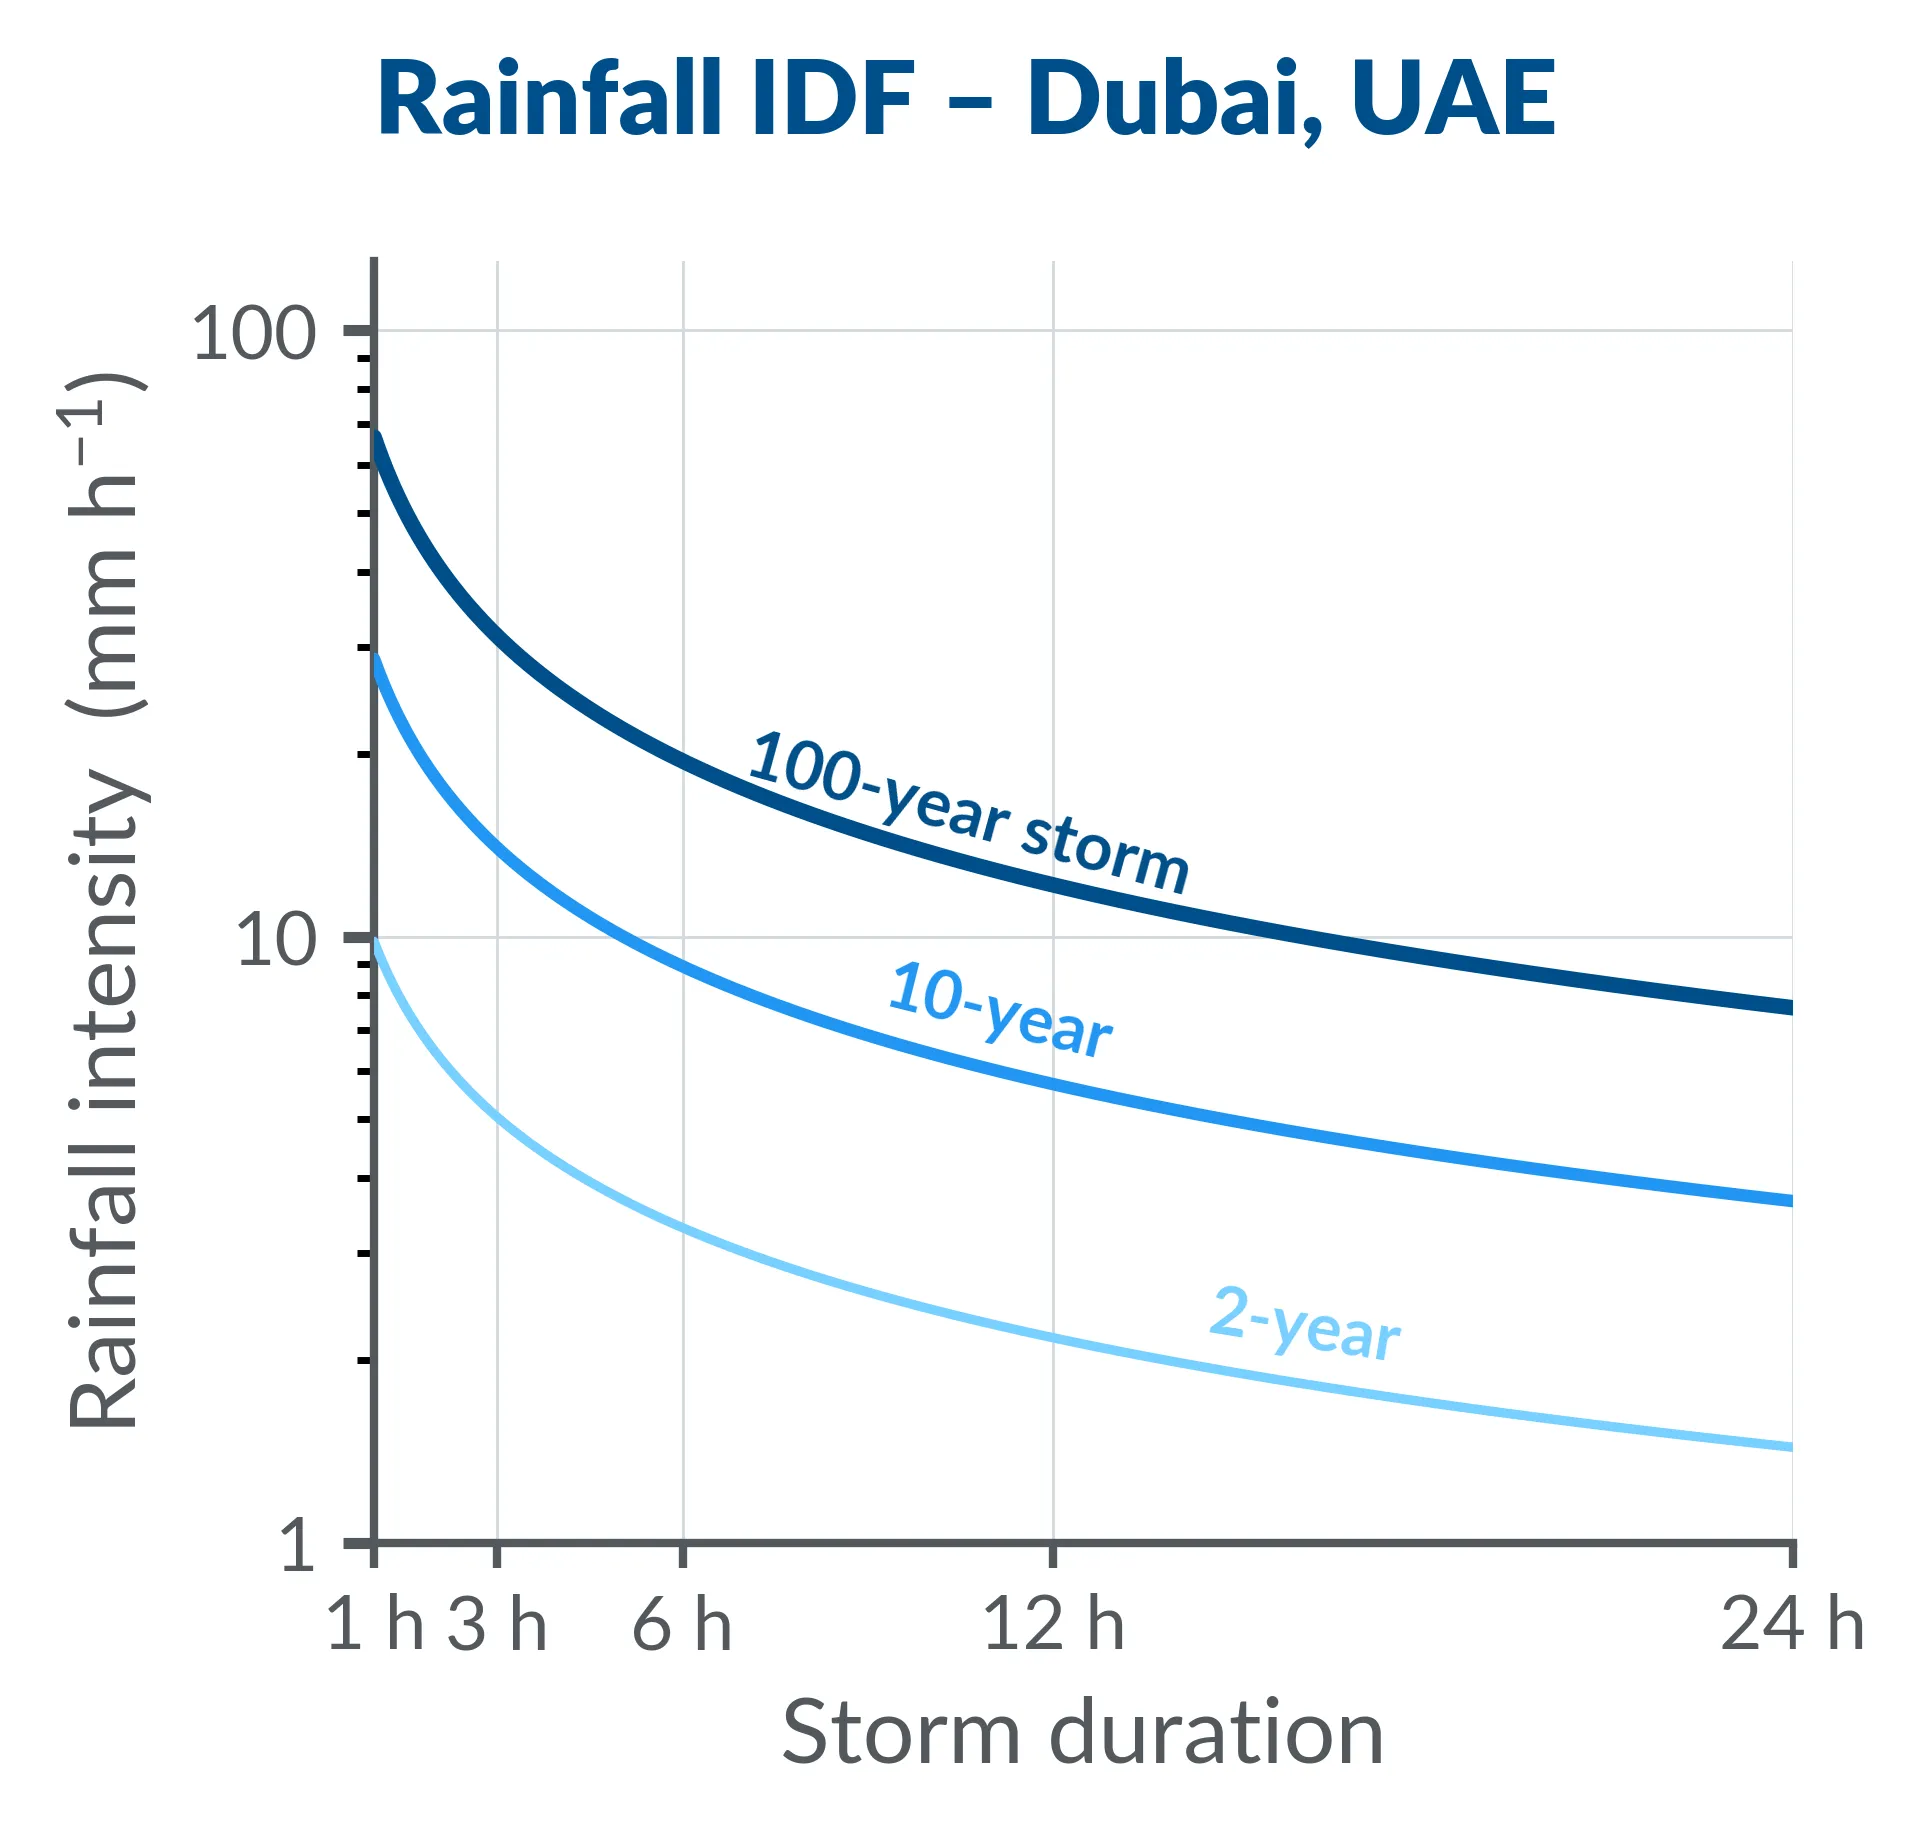
Historical and future rainfall IDF curves for stormwater, drainage, flood modeling, and resilience assessment.

Climate-informed design values for long-lived, exposure-sensitive infrastructure.

Site-specific climate parameters for passive design, envelope performance, and energy efficiency.
Degree days, solar, and temperature extremes for demand forecasting and grid planning.

We handle the climate science, data processing, and documentation.

Use the free explorer for standard values, with custom analysis and expert support available when the project requires more.

Support project assumptions with transparent methods, observation-informed data, and expert interpretation when needed.
The free explorer covers standard design values. Degree Day also supports project-specific climate analysis, independent review of existing datasets, and custom methods for decisions that do not fit a standard table.
Explore Independent Review & Advisory
Public climate datasets (like CMIP6) provide raw model outputs, but not engineering design values.
To use them for infrastructure design, you'd need to: download and process massive datasets (often terabytes); select appropriate models and scenarios; calibrate outputs to local weather station observations; and compute engineering-specific statistics (return periods, design temperatures, etc.).
Degree Day makes standard processed values available through the free explorer. We can also help determine which values are appropriate for a particular project, develop custom analyses, and provide documentation for technical review.
Degree Day's methods are documented in peer-reviewed research and informed by more than 15 years of experience applying climate data at organizations including WSP, Arup, and NOAA. Projections are adjusted using quality-controlled weather-station observations.
The explorer provides information on methods, data sources, and model ranges. Project-specific work can include more detailed methodology documentation, data provenance, recommended criteria, and support addressing technical-review questions.
Project-specific analyses can include a review of local climate conditions, observed trends, present and future design values, comparison with applicable standards, recommended criteria and sensitivity cases, methodology documentation, and data provenance.
Deliverables can be provided as a technical memorandum, documented PDF, spreadsheet, or custom dataset. Technical support is also available for reviewer and stakeholder questions.
We cover all global regions. Our dataset draws on over 70,000 weather stations worldwide for precipitation and over 20,000 for temperature.
The explorer provides values for locations worldwide. Where a project is not directly represented by a weather station, the methodology uses nearby observations and spatial climate information to estimate local conditions.
Degree Day can perform a more detailed local-data review where terrain, elevation, coastlines, urban effects, or limited station coverage create additional uncertainty.
Individual locations can be explored through the free application. For portfolios, Degree Day can provide batch processing, bulk data delivery, custom thresholds, comparative analysis, and technical support.
Standard values are free to view and use through the explorer. The complete underlying datasets are restricted.
Bulk files, API access, automated processing, commercial integration, and redistribution rights are available separately. Research access may also be available depending on the proposed use.
Standard location-level values are free to explore through the web application.
Pricing applies to services such as bulk data access, portfolio processing, custom variables or methods, project-specific interpretation, technical documentation, commercial integration, and ongoing support. These are scoped according to the number of locations, required metrics, documentation needs, and level of technical involvement.
