
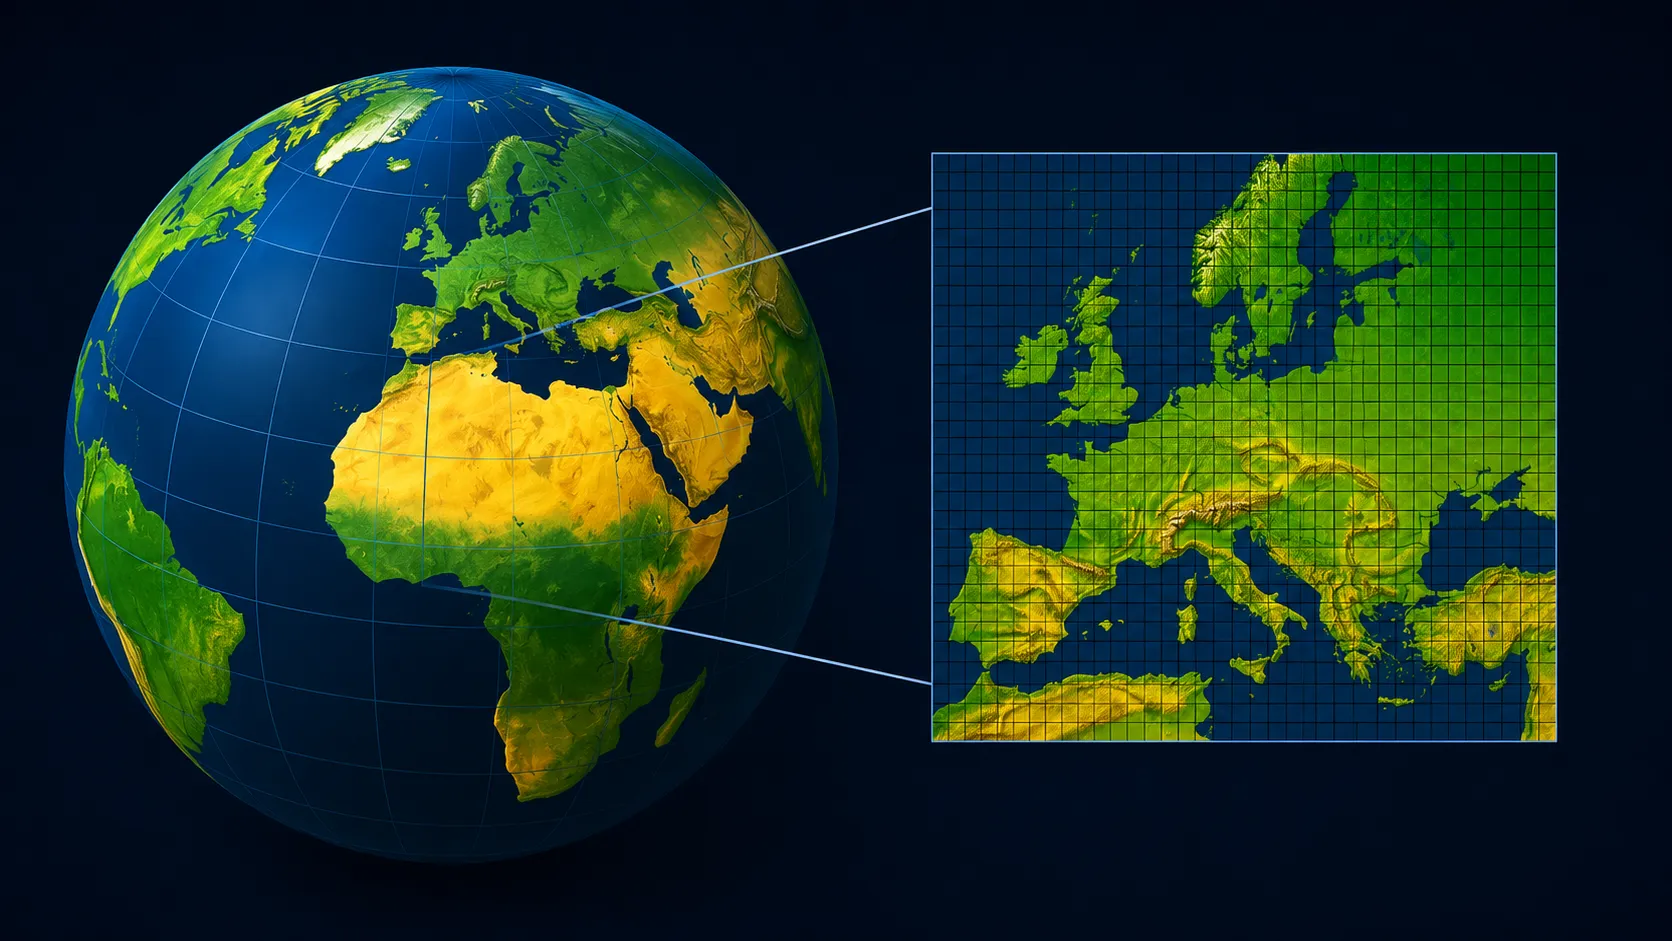
Climate models can be powerful tools for long-lived infrastructure decisions, but only when the data are interpreted and applied carefully. Most practitioners do not use raw global climate model output directly. Instead, they rely on downscaled datasets that translate coarse global projections into information that appears more relevant at regional or local scales.
There are two broad approaches to downscaling climate model data: statistical downscaling and dynamical downscaling.
Statistical downscaling uses historical relationships between large-scale climate model output and local observations or gridded reference datasets. It is computationally efficient, widely available, and often distributed through centralized platforms that are easy to use.
Dynamical downscaling uses regional climate models to simulate the atmosphere and land surface directly at higher resolution over a limited area. These models are more computationally expensive and harder to work with, but they can represent physical processes that coarse global models cannot resolve.
This difference matters for infrastructure design. A fine grid does not always mean the model has resolved the local physical processes that affect design conditions. Statistical downscaling can improve agreement with observed historical patterns, but it does not by itself simulate new regional dynamics. Regional climate models provide a more physically based alternative when local risks depend on mountains, coastlines, land–sea contrasts, storms, or other regional processes.
Two Approaches to Spatial Downscaling
Most high-resolution climate datasets used in applied planning today are produced through statistical downscaling. These products are popular for good reasons: they are accessible, computationally practical, and often available for many global climate models, emissions scenarios, variables, and time periods.
But accessibility is not the same thing as physical realism.
Many statistical downscaling products start with coarse global climate model output and adjust it to match historical local patterns at a finer grid scale. This can be useful, especially for broad screening and standardized analysis. But the finer grid should not be mistaken for a dynamically resolved simulation of local climate processes.
For example, if a global climate model does not resolve a mountain range, coastline, valley circulation, or storm-scale process, statistical refinement cannot fully recreate the physics of how that process may evolve in a warming climate. It can adjust the output based on historical relationships, but it does not run a higher-resolution atmosphere.
Regional climate models take a different approach. They use global climate models as boundary conditions, then simulate the regional climate at much finer spatial resolution within a limited domain. This allows them to better represent features such as topography, coastlines, land-surface contrasts, and regional circulation patterns.
In practical terms: statistical downscaling often makes climate model output easier to use. Regional climate models can make climate model output more physically informative. Neither approach is perfect, and both require careful evaluation before being used in high-stakes decisions.

The regional climate model explicitly simulates local processes such as topography and coastlines, producing finer spatial detail. The statistically downscaled global climate model re-grids coarse global model data to a finer resolution but does not add new physical information.
What Are Regional Climate Models?
Regional climate models, or RCMs, are high-resolution climate models run over a specific region rather than the entire globe. They are driven by global climate models along the boundaries of the regional domain, then simulate climate conditions inside that domain at finer spatial and temporal resolution.
A useful way to think about an RCM is as a physically based zoom lens. The global model provides the large-scale climate context. The regional model adds detail by explicitly simulating the regional atmosphere, land surface, and terrain at higher resolution.
This can matter a great deal for infrastructure. Many design-relevant hazards are shaped by regional processes that global models represent only coarsely. Orographic rainfall, sea breezes, heat extremes, cold-air pooling, tropical cyclone structure, wind patterns, and land–atmosphere feedbacks can all be sensitive to features that are blurred out in coarse global models.
By resolving those features more directly, regional climate models can provide information that is more physically connected to the processes engineers and planners care about.
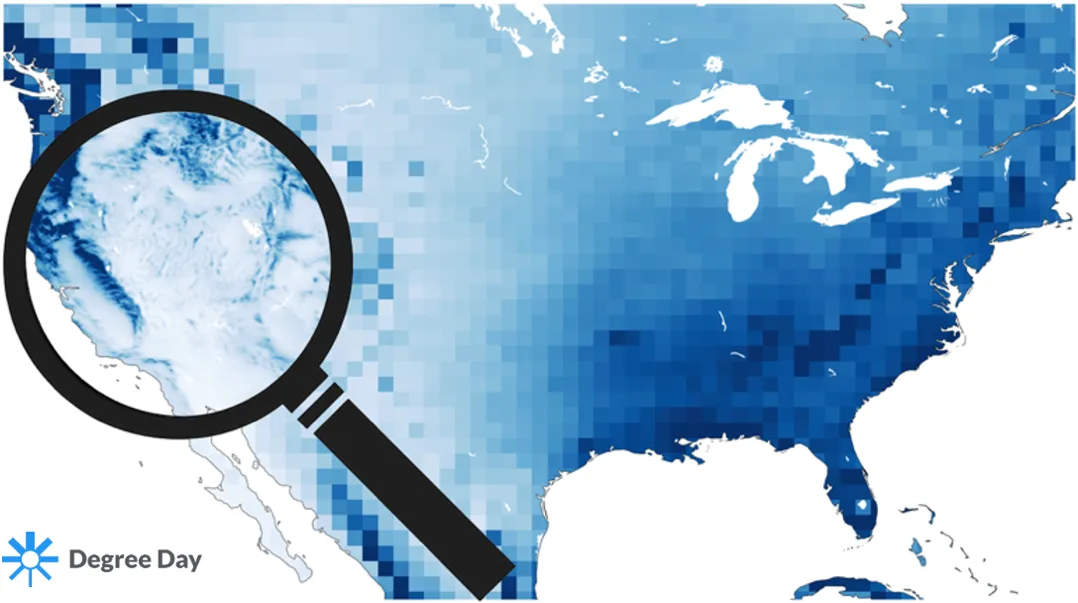
Regional climate models act like a magnifying glass for global models, dynamically enhancing the spatial resolution of climate projections to better capture local patterns and physical processes. While global models provide broad-scale context, RCMs refine this information to represent features such as topography-driven weather systems and localized extremes.
Strengths and Limitations of Regional Climate Models
Regional climate models have an important advantage: they simulate regional climate processes using physical equations rather than only adjusting global model output statistically.
This can improve the representation of climate features that matter for the built environment, including heavy rainfall, heat waves, cold snaps, coastal gradients, complex terrain effects, and regional wind patterns. For infrastructure projects, those details can influence design values, operating thresholds, asset performance, and long-term resilience planning.
But regional climate models are not automatically better for every use case.
They inherit biases from the global climate models that drive them. They can introduce their own regional-model biases. They cannot fully correct large-scale circulation errors. Their results can vary substantially across domains, model configurations, boundary conditions, and variables. They are also expensive to run and difficult to process at scale.
Most importantly, raw RCM output is not design-ready. It still needs to be evaluated against observations, bias-adjusted or calibrated where appropriate, and translated into practical indicators before it can support engineering or risk decisions.
In short: regional climate models add physical realism, but they are not turnkey. Their value comes from combining physically based regional simulation with careful evaluation, calibration, and applied interpretation.
Why Regional Climate Models Matter for Infrastructure
Infrastructure assets are designed for real places. Local conditions matter.
A stormwater system may depend on short-duration rainfall extremes. A substation may be sensitive to humid heat. A rail system may be affected by freeze-thaw cycles or extreme temperatures. A coastal facility may face risks shaped by land–sea contrasts, storms, and local terrain. A mountain road may be exposed to precipitation and wind regimes that are poorly represented by coarse global models.
For these kinds of applications, regional climate models can provide information that statistically downscaled global models may not fully capture. By resolving mountains, valleys, coastlines, land-surface gradients, and regional circulation features, RCMs can better represent some of the physical drivers behind local climate hazards.
This does not mean RCMs should be used blindly. It means they can provide an important line of evidence when infrastructure decisions depend on regional processes that coarse global models cannot resolve well.
For engineering and planning applications, the goal is not simply to use the highest-resolution dataset available. The goal is to use climate information that is physically credible, locally relevant, transparent, and appropriate for the decision being made.
CORDEX: A Coordinated Global Resource for Regional Climate Modeling
The Coordinated Regional Climate Downscaling Experiment, or CORDEX, is one of the world’s major efforts to produce regional climate projections using regional climate models.
CORDEX organizes simulations across regional domains around the world, allowing researchers and practitioners to examine climate change at higher spatial resolution than typical global climate model output. Depending on the domain and experiment, simulations are available at resolutions commonly around 50 km, with higher-resolution ensembles near 25 km or 12 km in some regions.
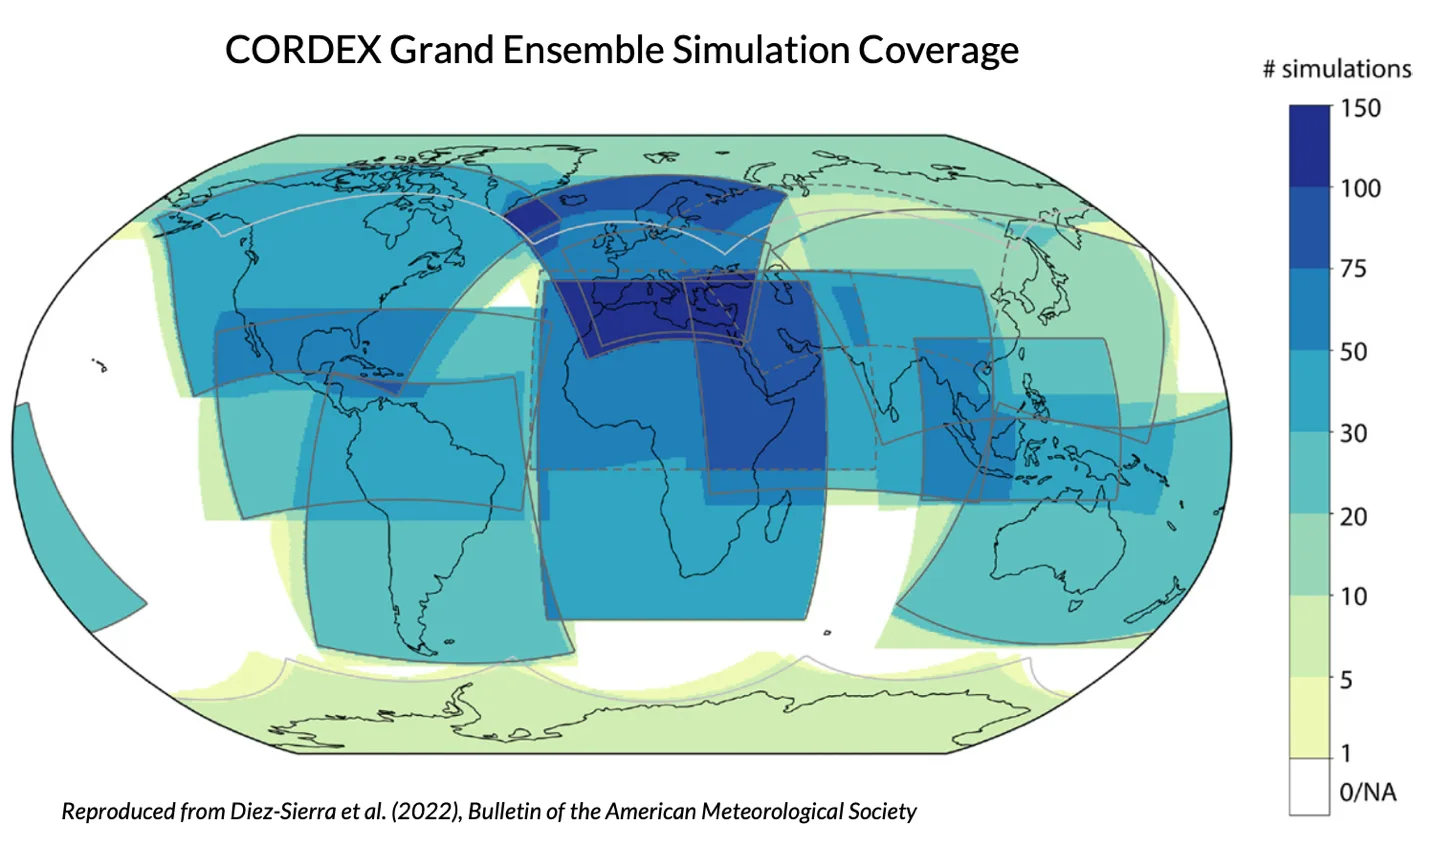
The CORDEX project from the World Climate Research Programme models future regional climate across nearly all global land areas and is featured in the IPCC Sixth Assessment Report Atlas.
This makes CORDEX a valuable resource for regional climate assessment. It has also been used in major scientific assessment efforts, including the IPCC Sixth Assessment Report Atlas. That matters because CORDEX is not a one-off dataset. It is part of a coordinated international modeling framework designed to improve understanding of regional climate change.
For practitioners, however, CORDEX is best understood as a scientifically recognized starting point. It is not a finished engineering product.
The archive contains physically based regional climate simulations, but those simulations still need to be cleaned, harmonized, evaluated, calibrated, and translated into decision-relevant metrics. Without that additional work, CORDEX remains difficult to use for infrastructure design, climate risk screening, portfolio analysis, or resilience planning.
Why CORDEX Is Rarely Used in Applied Design
CORDEX has major scientific value, but it is difficult to use in practice.
The raw archive is fragmented across many files, variables, regions, models, scenarios, institutions, naming conventions, and storage systems. Coverage is not uniform across regions or variables. File structures can be inconsistent. Model calendars, metadata, grid definitions, variable names, and units often need to be checked and harmonized before analysis can begin.
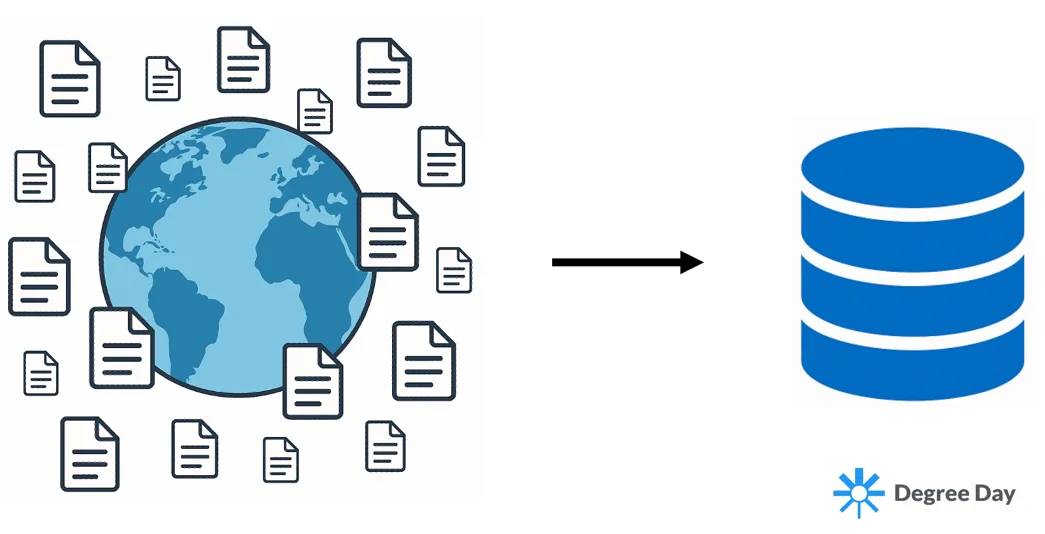
CORDEX model outputs are scattered across thousands of NetCDF files and dozens of modeling-center servers around the world. Degree Day collects, cleans, harmonizes, and archives this data into a single analysis-ready archive using the Zarr format, enabling fast access to a one-of-a-kind global dataset.
Even after the data are downloaded and cleaned, the outputs are generally not locally calibrated, design-ready time series. A practitioner still needs to evaluate the simulations against observations, account for model bias, handle missing or inconsistent data, and translate climate variables into indicators that matter for engineering and planning.
That workflow can require months of specialized climate-data engineering before any decision-relevant analysis begins.
This is one reason CORDEX is underused in global climate risk assessments. The science is valuable, but the usability barrier is high. Many organizations default to more accessible statistical products not because they are always more appropriate, but because they are easier to obtain, easier to process, and easier to explain.
CORDEX Has the Physics. Degree Day Makes It Analysis-Ready.
Degree Day closes the gap between scientific climate-model archives and applied infrastructure decisions.
We transform raw CORDEX simulations into harmonized, cloud-ready, locally calibrated datasets that can be used for climate risk assessment, resilience planning, and engineering studies. That means cleaning files, standardizing metadata, harmonizing variables and grids, organizing simulations into analysis-ready formats, and translating outputs into practical indicators.
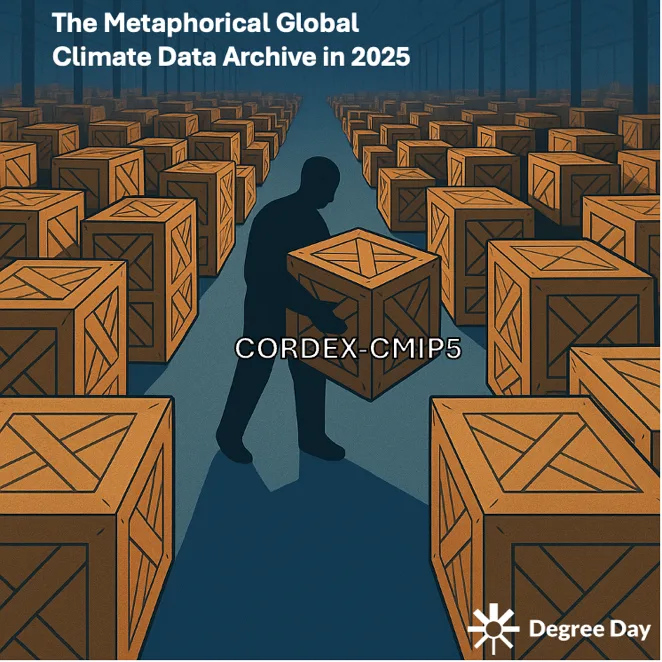
Degree Day makes CORDEX usable for applied work, giving engineers, planners, and climate risk professionals access to regional projections that would otherwise remain locked in scientific archives.
The result is a dataset that preserves the physical value of regional climate modeling while making it usable for applied work.
This matters because infrastructure practitioners do not need another folder of raw NetCDF files. They need defensible climate information that can support decisions. They need to understand which models are being used, how the data were processed, how local calibration was handled, what uncertainties remain, and how the outputs translate into practical design criteria.
Degree Day brings that applied layer to CORDEX. We make regional climate model data easier to access, easier to evaluate, and easier to use in high-stakes workflows. For engineers, planners, asset owners, and climate risk professionals, this creates a practical path to using physically based regional projections that would otherwise remain locked inside scientific archives.
What Degree Day’s CORDEX Archive Provides
Degree Day has downloaded, cleaned, harmonized, and organized more than 150,000 CORDEX NetCDF files across multiple regions and variables. We have converted the archive into cloud-optimized Zarr format so it can be accessed and analyzed efficiently at scale.
This curated archive supports applications such as:
- Climate risk assessments
- Infrastructure resilience studies
- Engineering design criteria
- Energy demand analysis
- Extreme temperature and precipitation indicators
- Multi-model intercomparison
- Portfolio-scale screening
- Regional climate model evaluation
- Custom hazard and exposure analytics
The archive is designed to reduce the time spent on data wrangling and increase the time available for actual analysis. Instead of starting with scattered files across multiple servers, users can work from a harmonized, analysis-ready archive built for applied climate workflows.
A More Defensible Path from Climate Models to Design Decisions
No climate dataset is perfect. Regional climate models have biases. Statistical downscaling has limitations. Global models vary in skill. Observations are incomplete. Future emissions, internal variability, and regional climate processes all introduce uncertainty.
The question is not whether one dataset is universally best. The question is whether the data are appropriate for the decision.
For infrastructure design and resilience planning, that means climate information should be physically credible, locally evaluated, transparent, and translated into metrics that practitioners can actually use. Regional climate models can provide an important source of information when local hazards depend on processes that coarse global models do not resolve well. But they require substantial processing before they can support applied decisions.
That is where Degree Day helps. CORDEX provides a physically grounded regional modeling framework. Degree Day makes it usable for design, risk, and resilience.
Access Degree Day’s Analysis-Ready CORDEX Archive
Degree Day has already done the hard work of collecting, cleaning, harmonizing, and organizing a global CORDEX archive for applied analysis.
If you are conducting climate risk assessments, infrastructure studies, portfolio screening, model intercomparisons, or custom climate indicator development, our curated CORDEX archive can save months of data preparation and help you move directly into analysis.
To discuss access, licensing, or applied analysis support, contact info@degreeday.org.
References
- Ashfaq, M. (2023). The low-resolution secrets of high-resolution statistical downscaling. The MyClimateBlog.
- Hong, S.-Y., & Kanamitsu, M. (2014). Dynamical downscaling: fundamental issues from a numerical weather prediction point of view and recommendations. Asia-Pacific Journal of Atmospheric Sciences, 50(1), 83–104.
- Maraun, D., & Widmann, M. (2018). Statistical Downscaling and Bias Correction for Climate Research. Cambridge University Press. DOI: 10.1017/9781107588783.
- Diez-Sierra, J., et al. (2022). The worldwide C3S CORDEX Grand Ensemble: A major contribution to assess regional climate change in the IPCC AR6 Atlas. Bulletin of the American Meteorological Society, 103(12), E2804–E2826. DOI: 10.1175/BAMS-D-22-0111.1.
- IPCC. (2021). Atlas. In Climate Change 2021: The Physical Science Basis. Contribution of Working Group I to the Sixth Assessment Report of the Intergovernmental Panel on Climate Change. Cambridge University Press.
