

Weather and climate data are increasingly used to inform engineering design, energy modeling, infrastructure planning, and climate risk assessment. These applications often depend on local accuracy. A small bias in temperature, humidity, wind speed, or solar radiation can affect design values, energy demand estimates, thermal comfort calculations, equipment sizing, and estimates of future exposure.
For many planning and engineering applications, weather stations remain the primary reference standard for local climate baselines. They measure conditions at specific places and remain the basis for many professional design standards. For example, ASHRAE publishes climatic design information for thousands of weather stations around the world through its Climatic Design Conditions web tool1, which supports heating, cooling, ventilation, and energy system design.
At the same time, gridded weather datasets such as ERA5 have become widely used in climate risk and resilience work. ERA5 is global, continuous, hourly, cloud-accessible, and available in places where station records may be incomplete or difficult to use. These are major strengths.
But ERA5 is not a weather station.
ERA5 represents modeled atmospheric conditions over grid cells. A single ERA5 grid cell is roughly 31 km by 31 km (about 19 by 19 miles), or about 1,000 square kilometers (386 square miles). Within that area, there may be cities, forests, rivers, coastlines, valleys, slopes, and different land-cover types. A weather station, by contrast, measures conditions at a specific point.
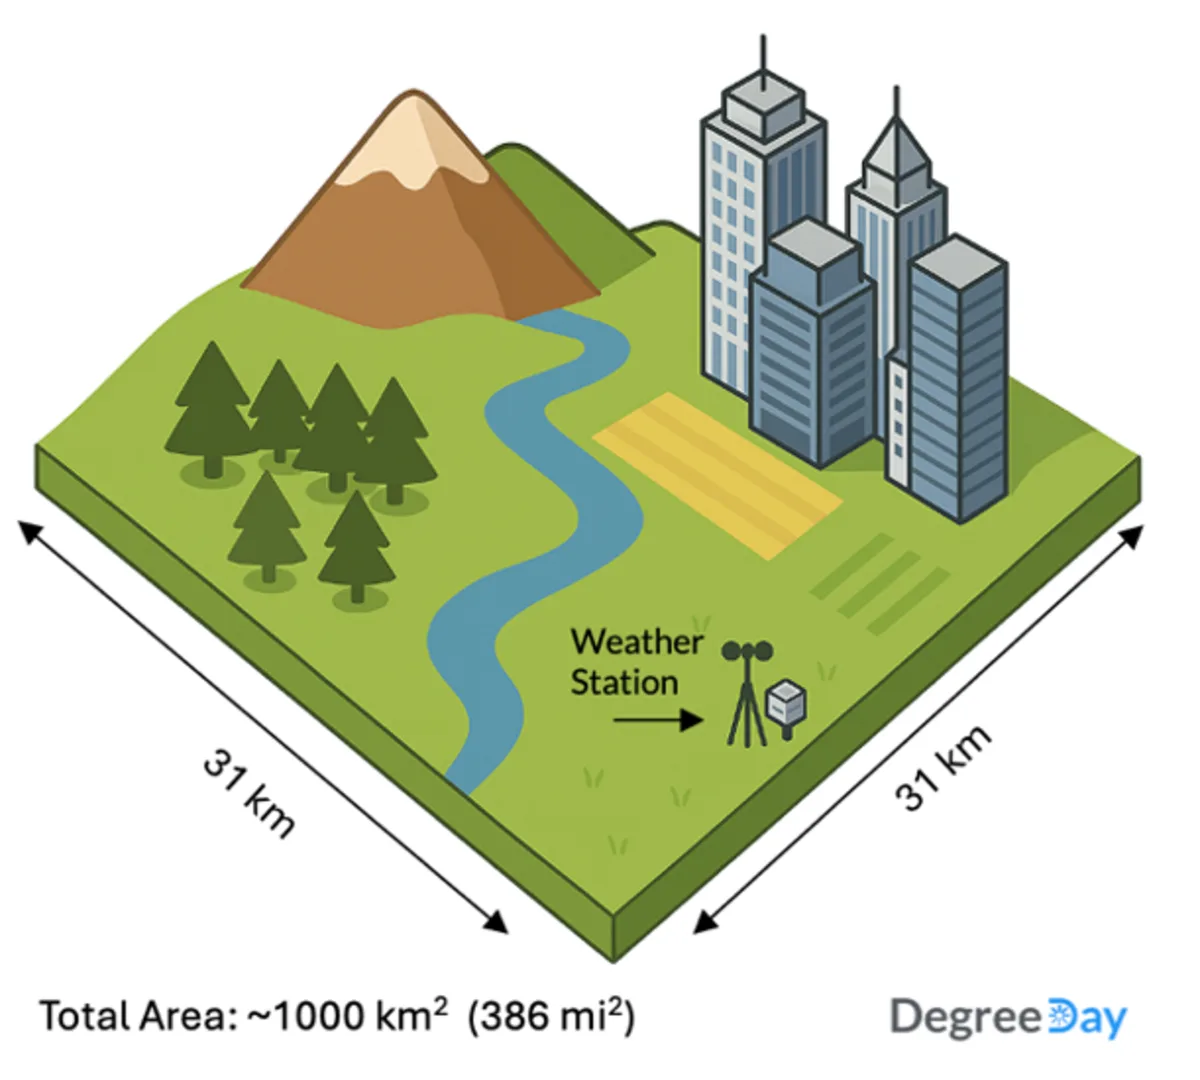
A single ERA5 grid cell spans roughly 31 km by 31 km (≈19 × 19 mi), or about 1,000 km² (386 mi²). It can contain mountains, forests, rivers, and cities. A weather station measures one point within it.
That difference matters. When gridded data are used as if they were local observations, systematic differences between modeled grid-cell conditions and observed station conditions can propagate into climate indicators, energy models, design criteria, and future climate risk assessments.
This is the problem SCOPE-ERA5 was built to address.
The baseline-data problem
Many climate risk workflows begin with a historical weather or climate baseline. That baseline is then used to calculate indicators, evaluate current exposure, train bias-adjustment methods, or compare future climate projections against present-day conditions.
If the baseline is biased, the downstream analysis can also be biased.
This matters because gridded products are often used in ways that require point-scale accuracy, even though they were not designed to reproduce individual weather station records. ERA5 can produce realistic large-scale weather patterns, but it may still differ from local observations in the mean, variability, extremes, or timing of specific events.
This is not a flaw in ERA5. It is a mismatch between dataset design and application. ERA5 is an extremely valuable global reanalysis product. The issue arises when it is treated as a direct substitute for local observations in applications that require station-scale accuracy.
The historical reference dataset is not a neutral choice
The choice of historical reference dataset can strongly influence the results of climate risk analysis2. This is especially true when the historical dataset is used to train bias-adjustment methods, generate downscaled projections, calculate baseline indicators, or estimate future impacts3.
The historical reference dataset is not just a background input. It can shape the baseline, the correction, the future projection, and the estimated consequence.
For planning and engineering applications, this makes observational benchmarking essential. Before using a gridded dataset to estimate design-relevant indicators, users should ask a basic question: does the dataset reproduce the local conditions that matter for the decision?
Why GMFD and NASA NEX-GDDP matter
ERA5 is not the only dataset where this issue matters. Another important example is the Global Meteorological Forcing Dataset, or GMFD4.
GMFD is important because many practitioners encounter it indirectly through NASA NEX-GDDP5, one of the most widely used statistically downscaled climate datasets in climate risk and resilience work. Users may not work with GMFD directly, but GMFD has served as the historical reference dataset underlying NEX-GDDP.
That makes GMFD more than a niche legacy dataset. If the historical reference dataset differs from station observations, those differences can affect downstream indicators derived from downscaled climate projections6. In other words, baseline-data bias can enter a workflow even when the user never knowingly selected the biased baseline dataset.
This is especially important for firms, utilities, insurers, developers, and infrastructure owners using downscaled climate data to evaluate future heat, energy demand, or design-relevant thresholds.
Comparing gridded data with station observations
To illustrate the issue, we compared station observations with two commonly used gridded datasets:
- ERA5, the global atmospheric reanalysis produced by ECMWF
- GMFD, a hybrid gridded forcing dataset used as a historical reference in NASA NEX-GDDP
As a simple example, we examined the average number of days per year where daily maximum temperature exceeded 32.2 °C (90 °F) across thousands of weather station locations.
For each station, values from ERA5 and GMFD were extracted at the station location using bilinear interpolation. The results were then compared with quality-controlled weather station observations. On the maps below, hexagons represent groups of nearby stations binned for easier visualization.
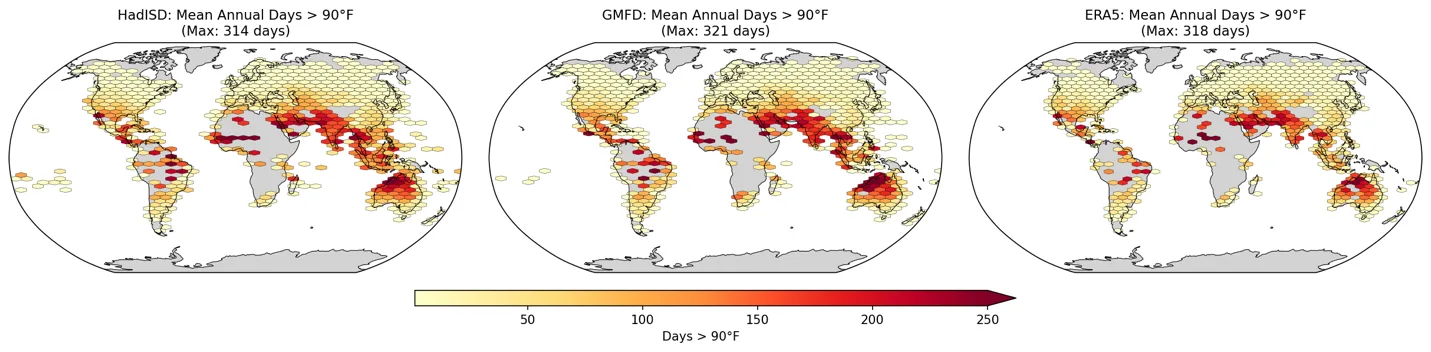
Mean annual number of days where the daily maximum temperature exceeded 32.2 °C (90 °F), shown for station observations, GMFD, and ERA5. Hexagons represent groups of nearby stations binned for easier visualization.
The comparison shows that gridded datasets can differ substantially from station observations. In some regions, ERA5 or GMFD may understate the number of hot days. In others, they may overstate them. These differences are not just visual artifacts; they represent real discrepancies in the local climate baselines used by downstream analyses.
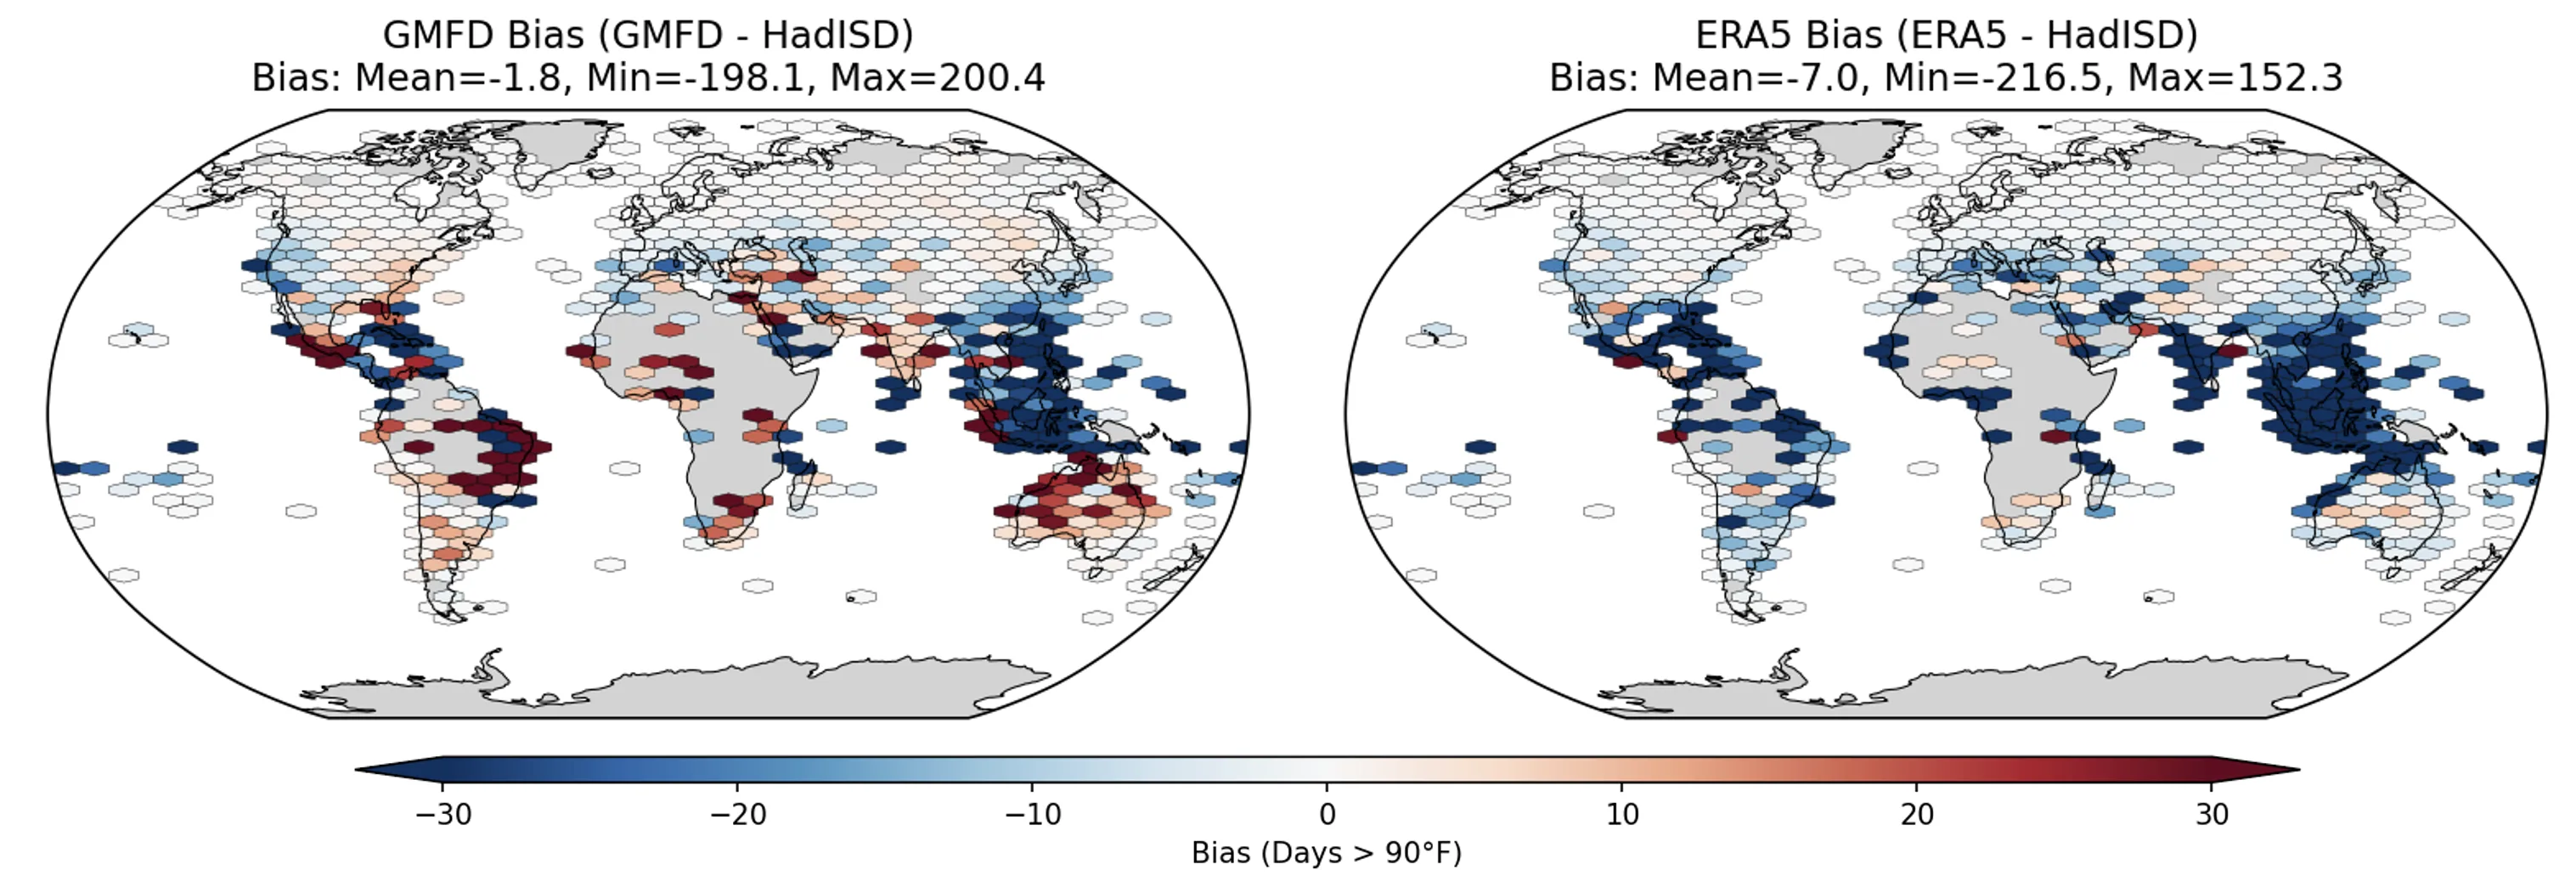
Bias in the mean annual number of days over 32.2 °C (90 °F), calculated as GMFD or ERA5 minus station observations. Negative values indicate underestimation relative to observations. Data are from 1985–2014.
This is only one indicator. Similar issues can occur for other variables and metrics, including humidity, wind speed, wet-bulb temperature, degree days, heat index, cold extremes, and design-day conditions.
You can explore these comparisons yourself in the SCOPE-ERA5 explorer web app7, which lets you compare station observations, raw ERA5, GMFD/NASA-NEX, and SCOPE-ERA5 indicators at weather stations around the world.
Why these differences matter
For some applications, a modest baseline difference may not matter much. But for planning and engineering applications, local accuracy can be material.
1. Biased baselines can lead to biased future projections
Many future climate workflows begin by adjusting climate model output to match a historical reference dataset. If that reference dataset is biased relative to local observations, the adjusted projections can inherit that bias.
This can affect climate indicators used for infrastructure design, building performance, asset screening, and resilience planning. In some cases, the bias in the historical reference dataset can be as large as, or larger than, the projected future change being analyzed8.
For example, consider an annual count of days above 32.2 °C (90 °F). If the historical baseline already shows too many hot days, future increases may be understated because the indicator is already close to saturation. If the baseline shows too few hot days, current exposure may be understated and future changes may appear larger or smaller than they really are.
A future projection should not be expected to eliminate uncertainty. But it should at least begin from a baseline that is as close as possible to observed local conditions.
2. Small weather-data biases can produce large downstream errors
Engineering and energy systems often respond nonlinearly to weather conditions. A small temperature bias can affect cooling loads, peak demand estimates, heat stress metrics, material performance, and equipment sizing. A humidity bias can affect heat index, wet-bulb temperature, HVAC performance, and indoor comfort. A wind speed bias can affect wind loading, dispersion, outdoor thermal comfort, and renewable energy analysis.
The input difference may look small, but the system response may not be.
That is why reducing bias in the weather and climate inputs can improve the reliability of downstream risk estimates, energy simulations, and planning decisions.
3. Accuracy builds credibility with decision-makers
Climate risk analysis often asks decision-makers to act on uncertain future information. That is difficult enough. If the historical baseline does not resemble observed conditions, confidence in the entire analysis can erode.
Benchmarking against station observations helps users understand where a dataset performs well, where it does not, and how much confidence to place in derived indicators. Agreement with observations does not eliminate future uncertainty, but it strengthens the foundation of the analysis.
Introducing SCOPE-ERA5
SCOPE-ERA5, short for Station-Calibrated Outputs for Planning & Engineering, is Degree Day’s solution to this baseline-data problem.
SCOPE-ERA5 starts with ERA5 and calibrates it against high-quality in-situ weather station observations. The goal is not to replace ERA5. The goal is to make ERA5 more useful for applications that need a point-based frame of reference.
The result is a daily, gap-free, multivariate dataset that better aligns with observed station conditions while retaining the temporal continuity and physical sequencing of ERA5.
SCOPE-ERA5 is designed for planning, engineering, energy, and climate risk applications where local accuracy matters.
What SCOPE-ERA5 provides
SCOPE-ERA5 provides station-calibrated daily weather time series and derived climate indicators for locations around the world.
The dataset includes core weather variables relevant to infrastructure, energy, and risk analysis, including temperature, humidity, wind speed, and surface pressure. These variables are adjusted together using a multivariate bias-correction approach so that relationships among variables are preserved more realistically than with independent single-variable adjustments.
This matters because many engineering-relevant indicators are derived from multiple variables. Heat index depends on temperature and humidity. Wet-bulb temperature depends on temperature, humidity, and pressure. Building energy demand depends on combinations of temperature, humidity, wind, and solar conditions. Correcting one variable at a time can improve individual distributions while still producing unrealistic combinations of weather conditions.
SCOPE-ERA5 is designed to support derived indicators such as:
- Heating and cooling degree days
- Days above or below temperature thresholds
- Heat index and wet-bulb temperature
- Diurnal temperature range
- Hot, cold, and humid design conditions
- Climate indicators for energy, infrastructure, and resilience planning
How much does SCOPE-ERA5 improve the baseline?
In the hot-day example shown earlier, SCOPE-ERA5 substantially reduces the bias in the number of days exceeding 32.2 °C (90 °F) relative to station observations.
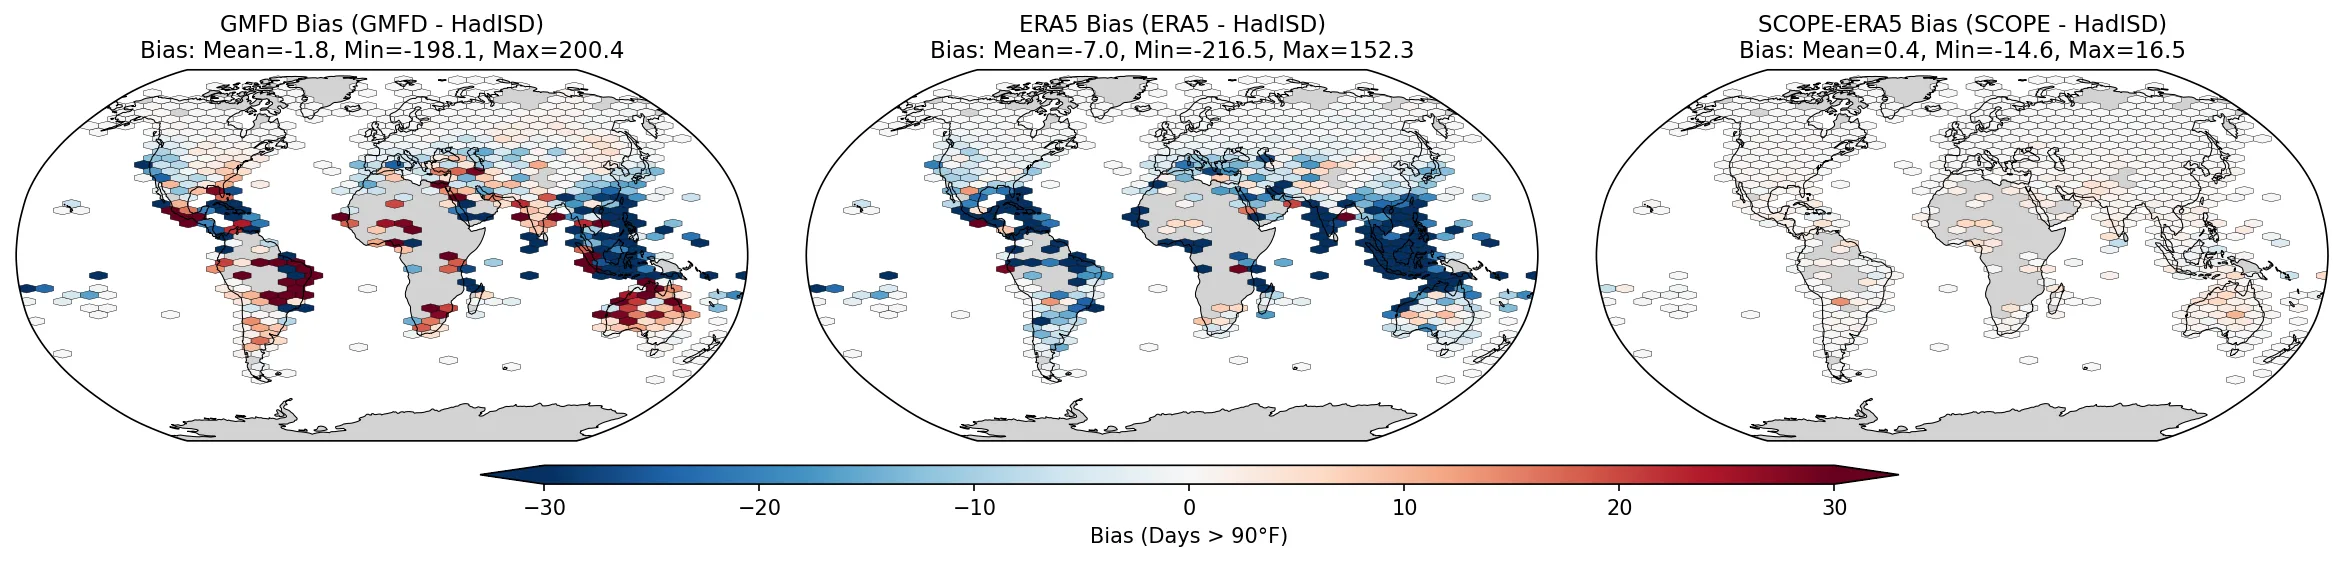
Bias in the mean annual number of days over 32.2 °C (90 °F), shown for GMFD, ERA5, and SCOPE-ERA5 relative to station observations. SCOPE-ERA5 (right) brings the bias close to zero across the majority of stations.
The improvement is not limited to this one indicator. Across variables, SCOPE-ERA5 reduces mean bias and root mean square error at most weather stations. The largest improvements are often found where raw ERA5 differs most from local station observations, including variables such as wind speed that are strongly influenced by local terrain, land cover, and station exposure.
To make this concrete, take Mumbai’s main airport (Chhatrapati Shivaji Maharaj International). In a typical year the local station records about 177 days above 32.2 °C (90 °F). Raw ERA5 records zero, because its grid-cell average smooths the local heat away. ERA5 misses in the other direction too, over-counting warm nights above 20 °C (68 °F), at 364 versus 297 observed. SCOPE-ERA5 brings both back in line (176 hot days and 299 warm nights) and roughly halves the day-to-day error at the site: the root mean square error in daily maximum temperature drops from 2.85 °C (5.1 °F) to 1.05 °C (1.9 °F), and in surface wind speed from 1.36 m/s (3.0 mph) to 0.57 m/s (1.3 mph).
Across the full network, SCOPE-ERA5 spans more than 15,000 stations in 197 countries, with continuous daily records from 1979 to 2025. This turns fragmented station histories into gap-free, locally calibrated series.
Out-of-sample testing is important because SCOPE-ERA5 is intended to correct persistent differences between ERA5 grid-cell estimates and station-scale conditions, not simply fit one calibration period. When the adjustment is applied to an independent period, performance declines only modestly, indicating that the correction is temporally robust.
What SCOPE-ERA5 is, and what it is not
SCOPE-ERA5 is a station-calibrated version of ERA5 designed for applications that require local accuracy. It is especially useful when users need continuous, gap-free weather time series that better match observed station conditions.
SCOPE-ERA5 is not a replacement for all site-specific analysis. It does not eliminate uncertainty. It does not make future climate projections certain. It does not replace detailed engineering judgment, local site studies, hydraulic modeling, wind engineering, or project-specific design analysis.
Instead, SCOPE-ERA5 improves one of the most important foundations of climate risk analysis: the historical weather and climate baseline.
ERA5 provides global consistency. Weather stations provide local reference conditions. SCOPE-ERA5 connects the two.
Explore SCOPE-ERA5
Degree Day has developed an interactive SCOPE-ERA5 web app that allows users to compare station observations, raw ERA5, GMFD/NASA-NEX, and SCOPE-ERA5 indicators at weather stations around the world.
The app is designed to make the baseline-data problem visible. Users can explore how gridded datasets compare with station observations and how SCOPE-ERA5 improves the representation of local weather and climate indicators.
Several global climatological indicators and a subset of daily time series are available for research and demonstration purposes. The full dataset is available upon request.
- Explore the SCOPE-ERA5 app: scope-era5.degreeday.org
- Read the paper: Multivariate bias correction of ERA5 using in-situ observations for planning and engineering. Environmental Research: Climate
- Contact: info@degreeday.org
For project-specific access, commercial use, or collaboration inquiries, contact Degree Day.
References and resources
- ASHRAE Climatic Design Conditions web tool. https://ashrae-meteo.info/
- Gao, J., Sheshukov, A. Y., Yen, H., Douglas-Mankin, K. R., White, M. J., and Arnold, J. G. (2019). Uncertainty of hydrologic processes caused by bias-corrected CMIP5 climate change projections with alternative historical data sources. Journal of Hydrology, 568, 551–561. https://doi.org/10.1016/j.jhydrol.2018.10.041
- Rastogi, D., Lehner, F., and Ashfaq, M. (2022). How may the choice of downscaling techniques and observational data sets affect future hydroclimate projections? Earth’s Future, 10, e2022EF002734. https://doi.org/10.1029/2022EF002734
- Sheffield, J., Goteti, G., and Wood, E. F. (2006). Development of a 50-Year High-Resolution Global Dataset of Meteorological Forcings for Land Surface Modeling. Journal of Climate, 19(13), 3088–3111. https://doi.org/10.1175/JCLI3790.1
- Thrasher, B., Wang, W., Michaelis, A., Melton, F., Lee, T., and Nemani, R. (2022). NASA Global Daily Downscaled Projections, CMIP6. Scientific Data, 9, 262. https://doi.org/10.1038/s41597-022-01393-4
- Miller, S., Ormaza-Zulueta, N., Koppa, N., and Dancer, A. (2025). Statistical downscaling differences strongly alter projected climate damages. Communications Earth & Environment, 6, Article 145. https://doi.org/10.1038/s43247-025-02134-2
- Degree Day SCOPE-ERA5 web app. https://scope-era5.degreeday.org/
- Schwarzwald, K., Lenssen, N., Horton, R., Bonanno, A., and Wagner, G. (2026). The choice of historical data product dominates climate uncertainty in projections of climate impacts in a 2-degree world. EGU General Assembly 2026, Vienna, Austria, 3–8 May 2026, EGU26-11680. https://doi.org/10.5194/egusphere-egu26-11680
- Degree Day SCOPE-ERA5 paper: Multivariate bias correction of ERA5 using in-situ observations for planning and engineering. https://iopscience.iop.org/article/10.1088/2752-5295/ae63ee
