
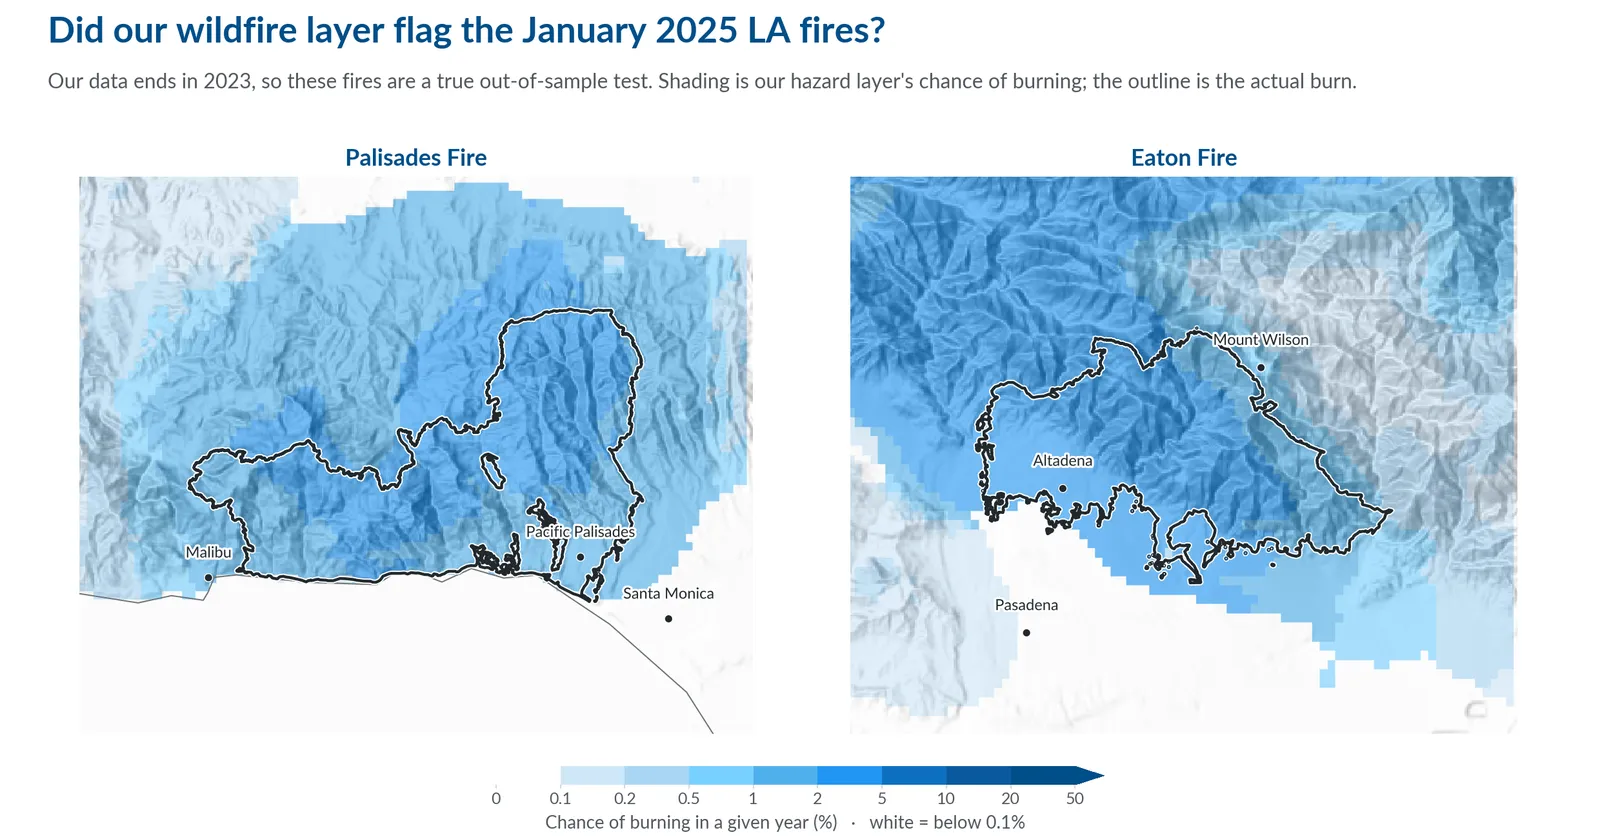
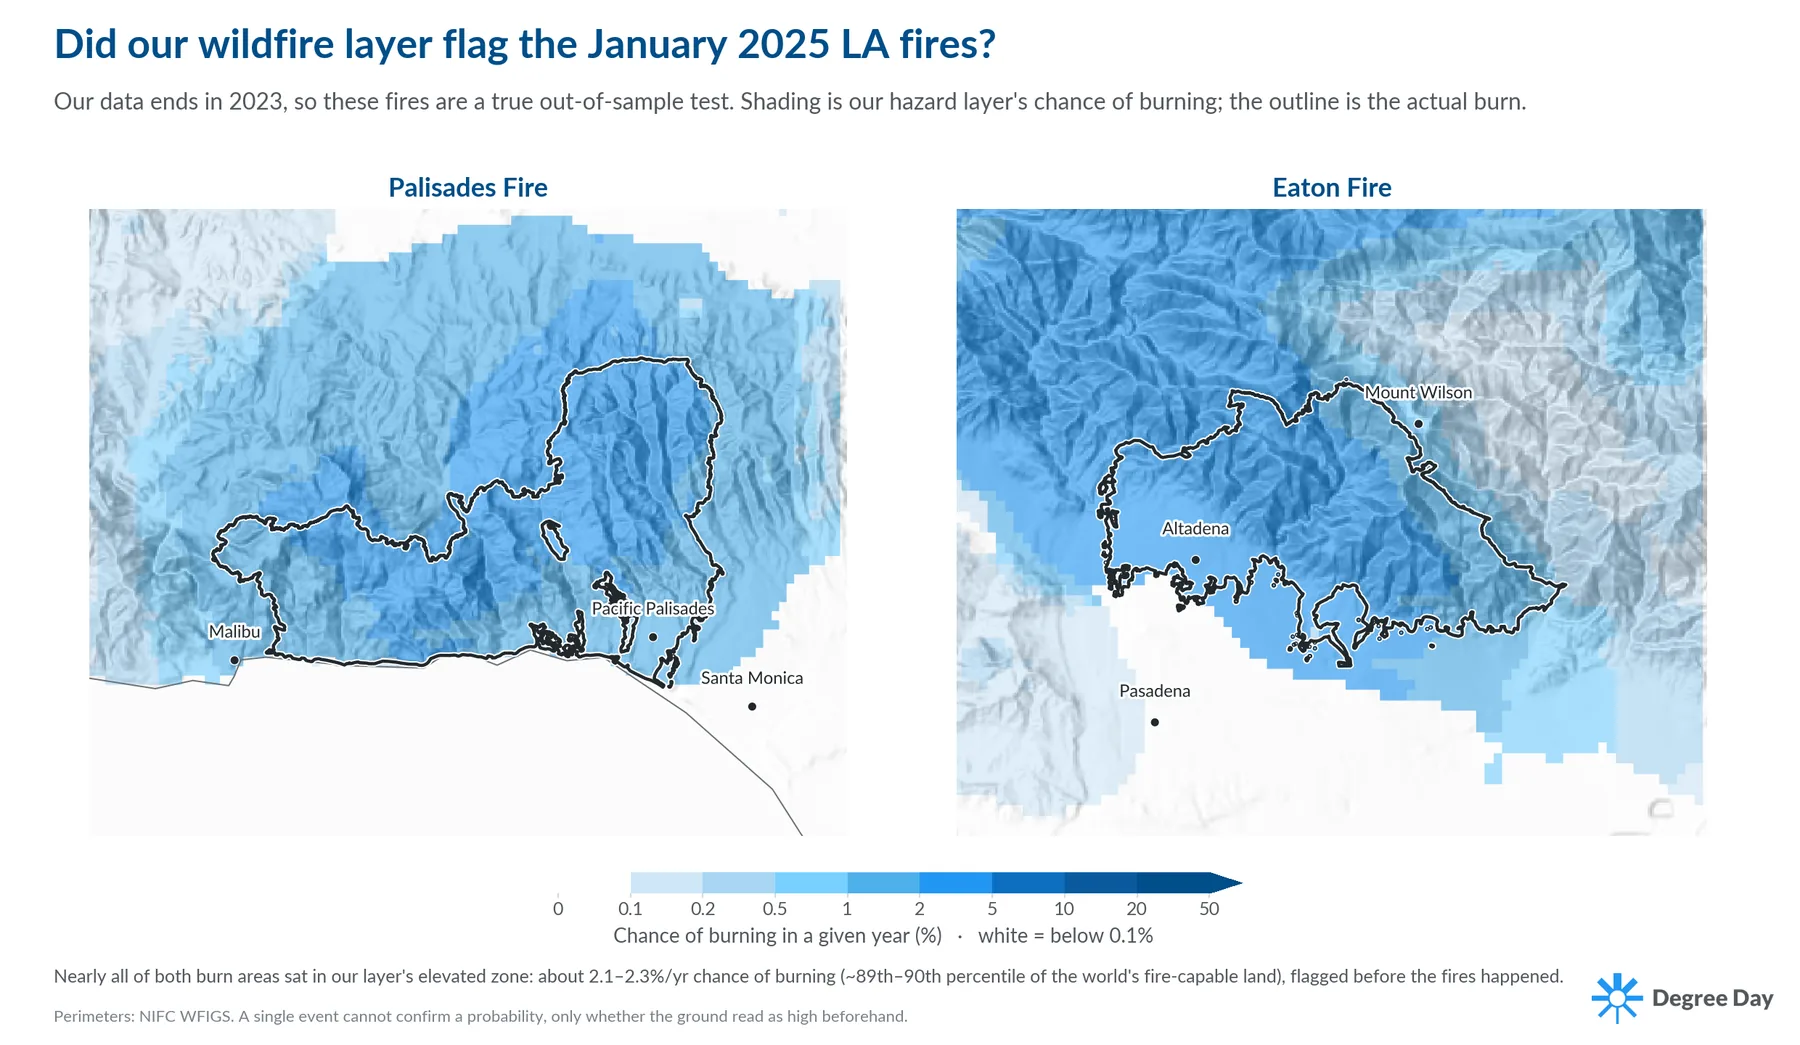
In January 2025, wind-driven fire tore through the hills above Los Angeles. The Palisades and Eaton fires leveled entire neighborhoods and caused property losses estimated between $28 billion and $54 billion8. When the smoke cleared, we asked the question every risk model should have to answer: had our layer already flagged that ground as dangerous, before it burned?
It had. Nearly the entire footprint of both fires sat in the model’s highest tier, among the most fire-prone land on Earth. That is a satisfying result, and it is also, on its own, almost meaningless. A single fire cannot tell you whether a model is genuinely skillful or simply lucky. This article sets out the tests that can, and what they showed.
Why we exclude fire history
Wildfire hazard is changing rapidly. Fire seasons are lengthening, the most dangerous fire-weather days are becoming more common1,5, and more property is built into flammable landscapes every year. That combination is why measuring wildfire risk has become so important to insurers, lenders, and anyone responsible for buildings and infrastructure.
Historical fire occurrence is an obvious predictor of future fire, but we deliberately do not use prior burn history as a model input. Doing so would make it difficult to distinguish between a model that has learned the underlying drivers of fire and one that is simply reproducing the historical burn map. The record is also short, uneven, and increasingly out of date: many of California’s largest fires are recent, and a model leaning on a quiet past would have ranked those hillsides low.
We train gradient-boosted regression trees6 on the relationship between observed burned area and the conditions that drive fire: fire-season weather, the vegetation available to burn, terrain, and the human activity that supplies ignitions. Observed fire is the training target. It is not among the predictors, and no input tells the model whether a given location has burned before. The rest of this article is how we tested whether that works.
How we tested it
A model scored on the observations it was fitted to will flatter itself, since it can do well by reproducing what it has already seen. None of the results below are evaluated on the same observations the model trained on.
We withhold data in three ways. First, spatially: the world is partitioned into blocks roughly a thousand kilometres across, and fire in each block is predicted only by a model trained with that block removed, so local skill cannot come from memorising the immediate surroundings. Second, by continent: the model learns from the rest of the world and is asked to map a continent absent from its training data. This is the situation the model is actually in for countries with no detailed fire records of their own. Third, in time: we train on the earlier years of the record and test on later fires.
Across all of these, we measure how well the model sorts land from most to least likely to burn. The score answers one question: take an area that later burned and an area that did not, and ask how often the model ranked the burned one higher. A score of 0.5 means it did no better than a coin flip. A score of 1.0 means it got every pair right. This is the statistic usually called AUC. We also compare against simple baselines, such as assigning every location the average burn rate of its vegetation type, so that a high score reflects skill rather than the structure of the problem.
Comparison with independent fire records
The first test is the most direct: does the model put fire where the record says fire happened? We compare it against independent fire databases it never trained on, including Monitoring Trends in Burn Severity (MTBS), the official United States burn record3; Canada’s National Burned Area Composite (NBAC)4; the European Forest Fire Information System (EFFIS)9; and global satellite burned-area records derived from MODIS, the Moderate Resolution Imaging Spectroradiometer2,7. These are the record names that appear in the figures below.
As a first, coarse check, the model reproduces the total area burned in Canada, as mapped by the Canadian government, to within about one percent. That is weak evidence on its own: a model can reproduce a national total exactly while placing the fire in the wrong locations. The more informative question is whether high-ranked areas coincide with observed fire. The maps below show the observations and the model side by side, on the same color scale, so you can judge both the overall amount of fire and, more importantly, whether the model paints its high-risk colors in the same places nature does.
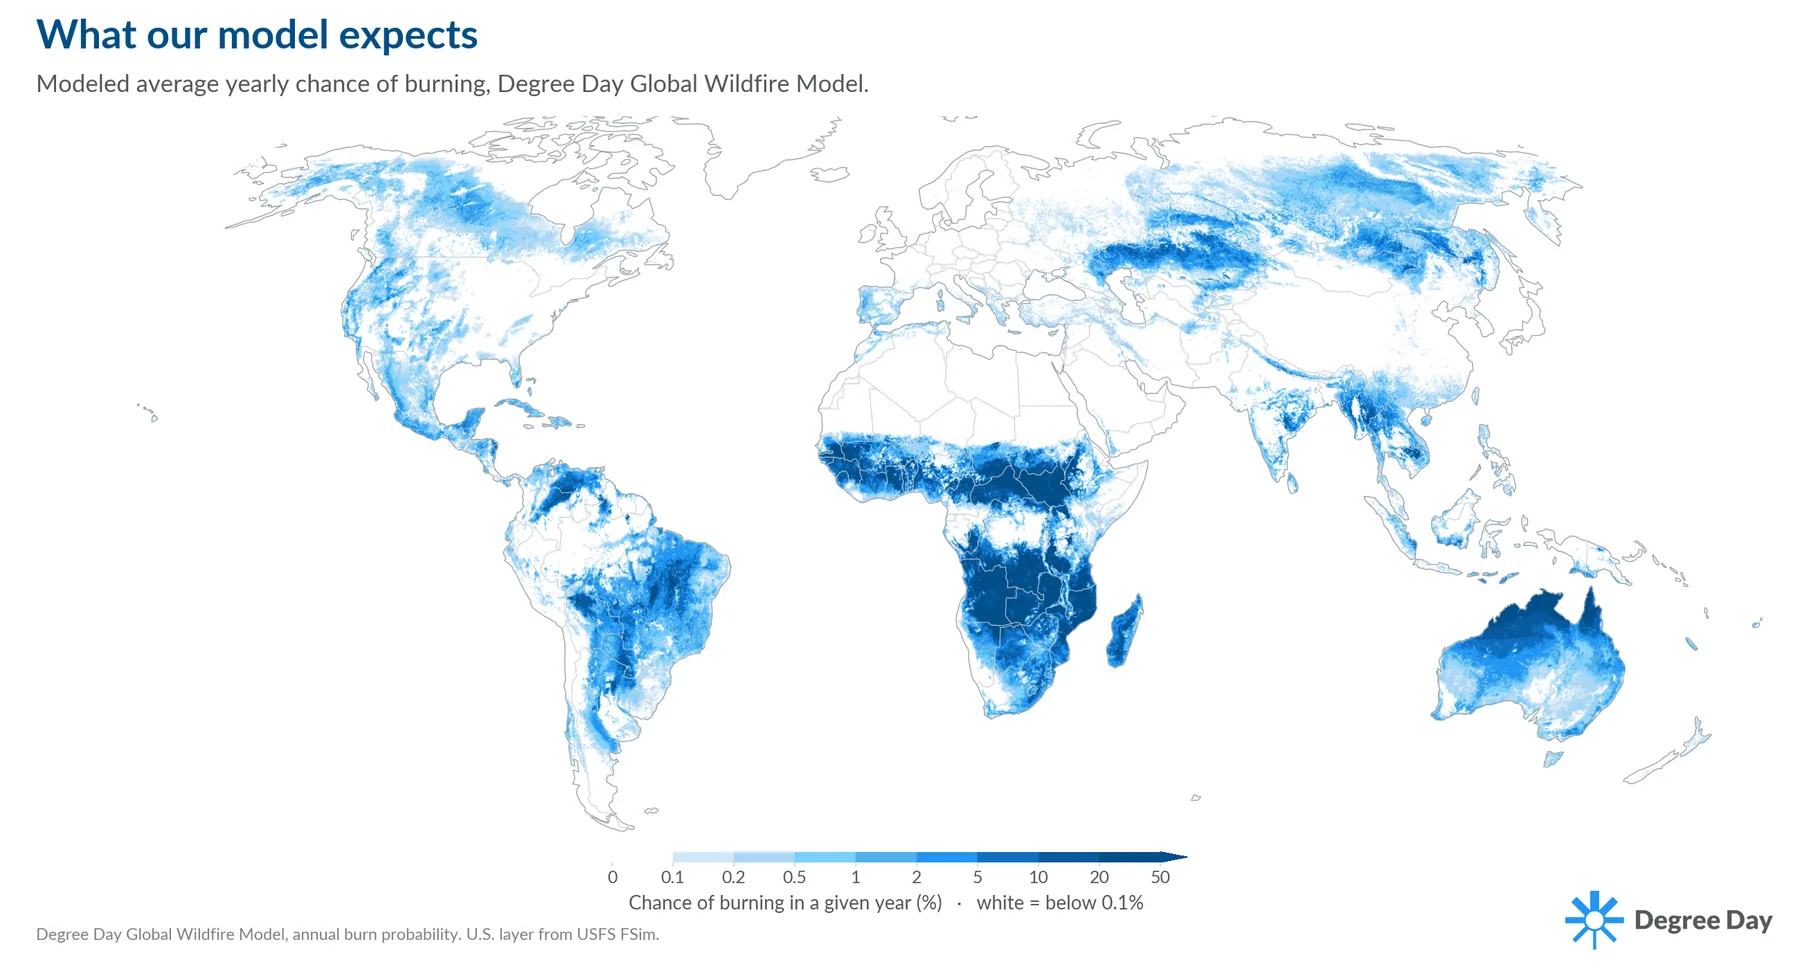
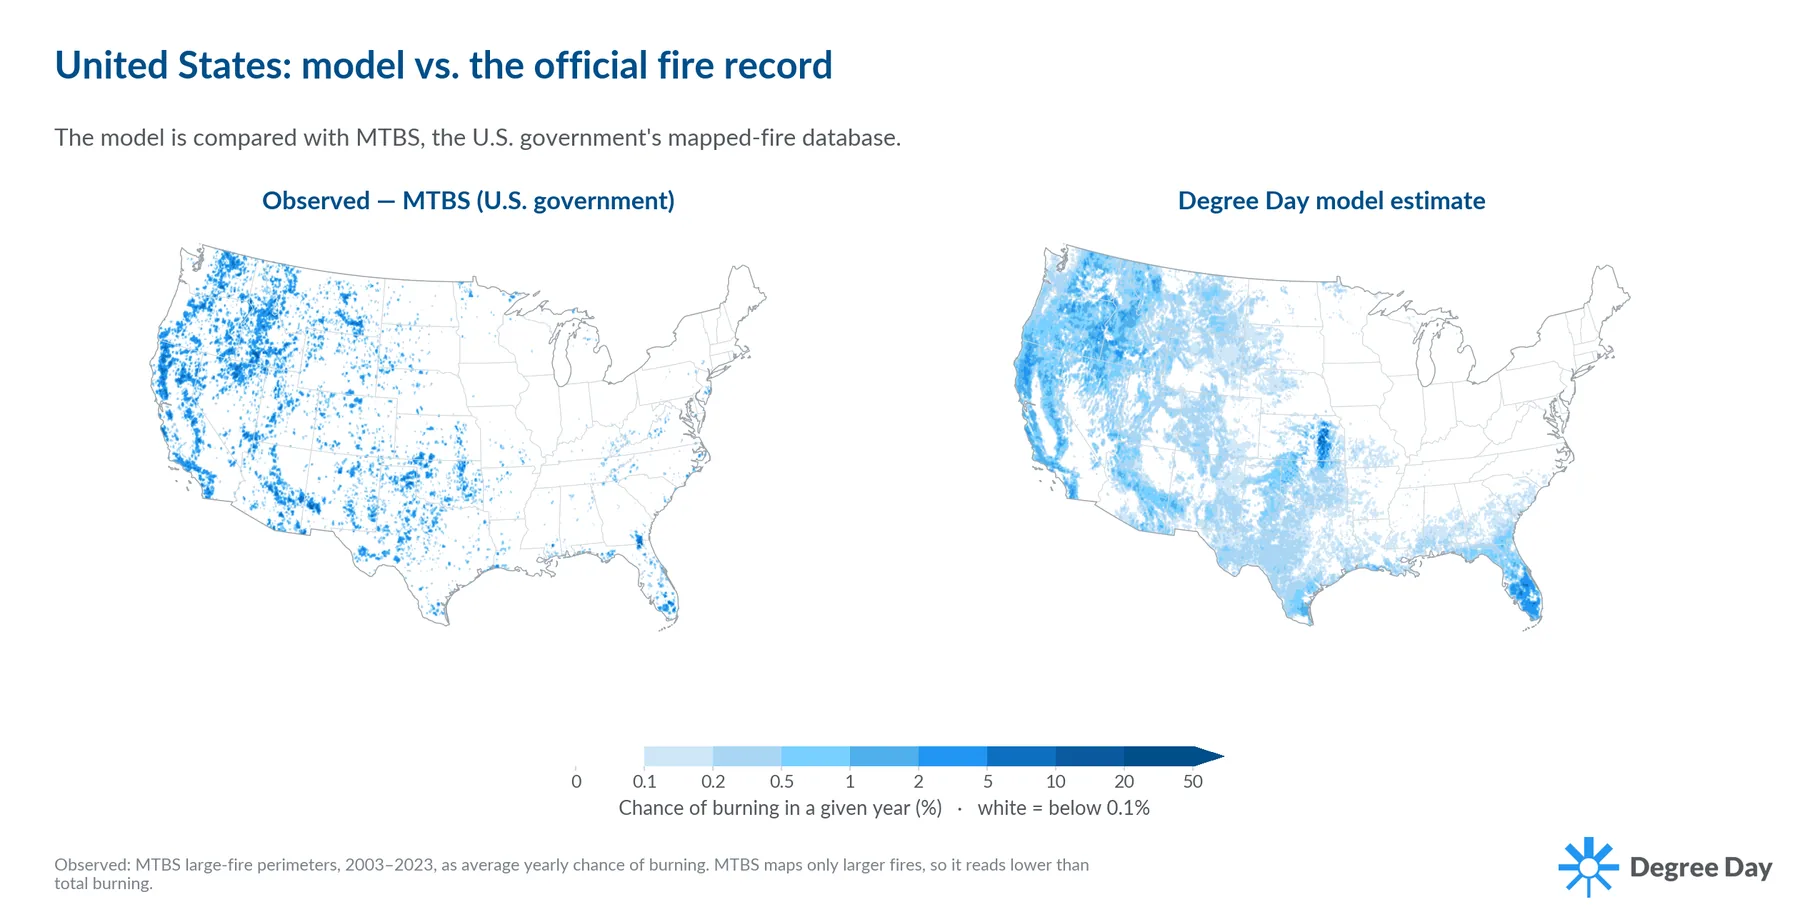
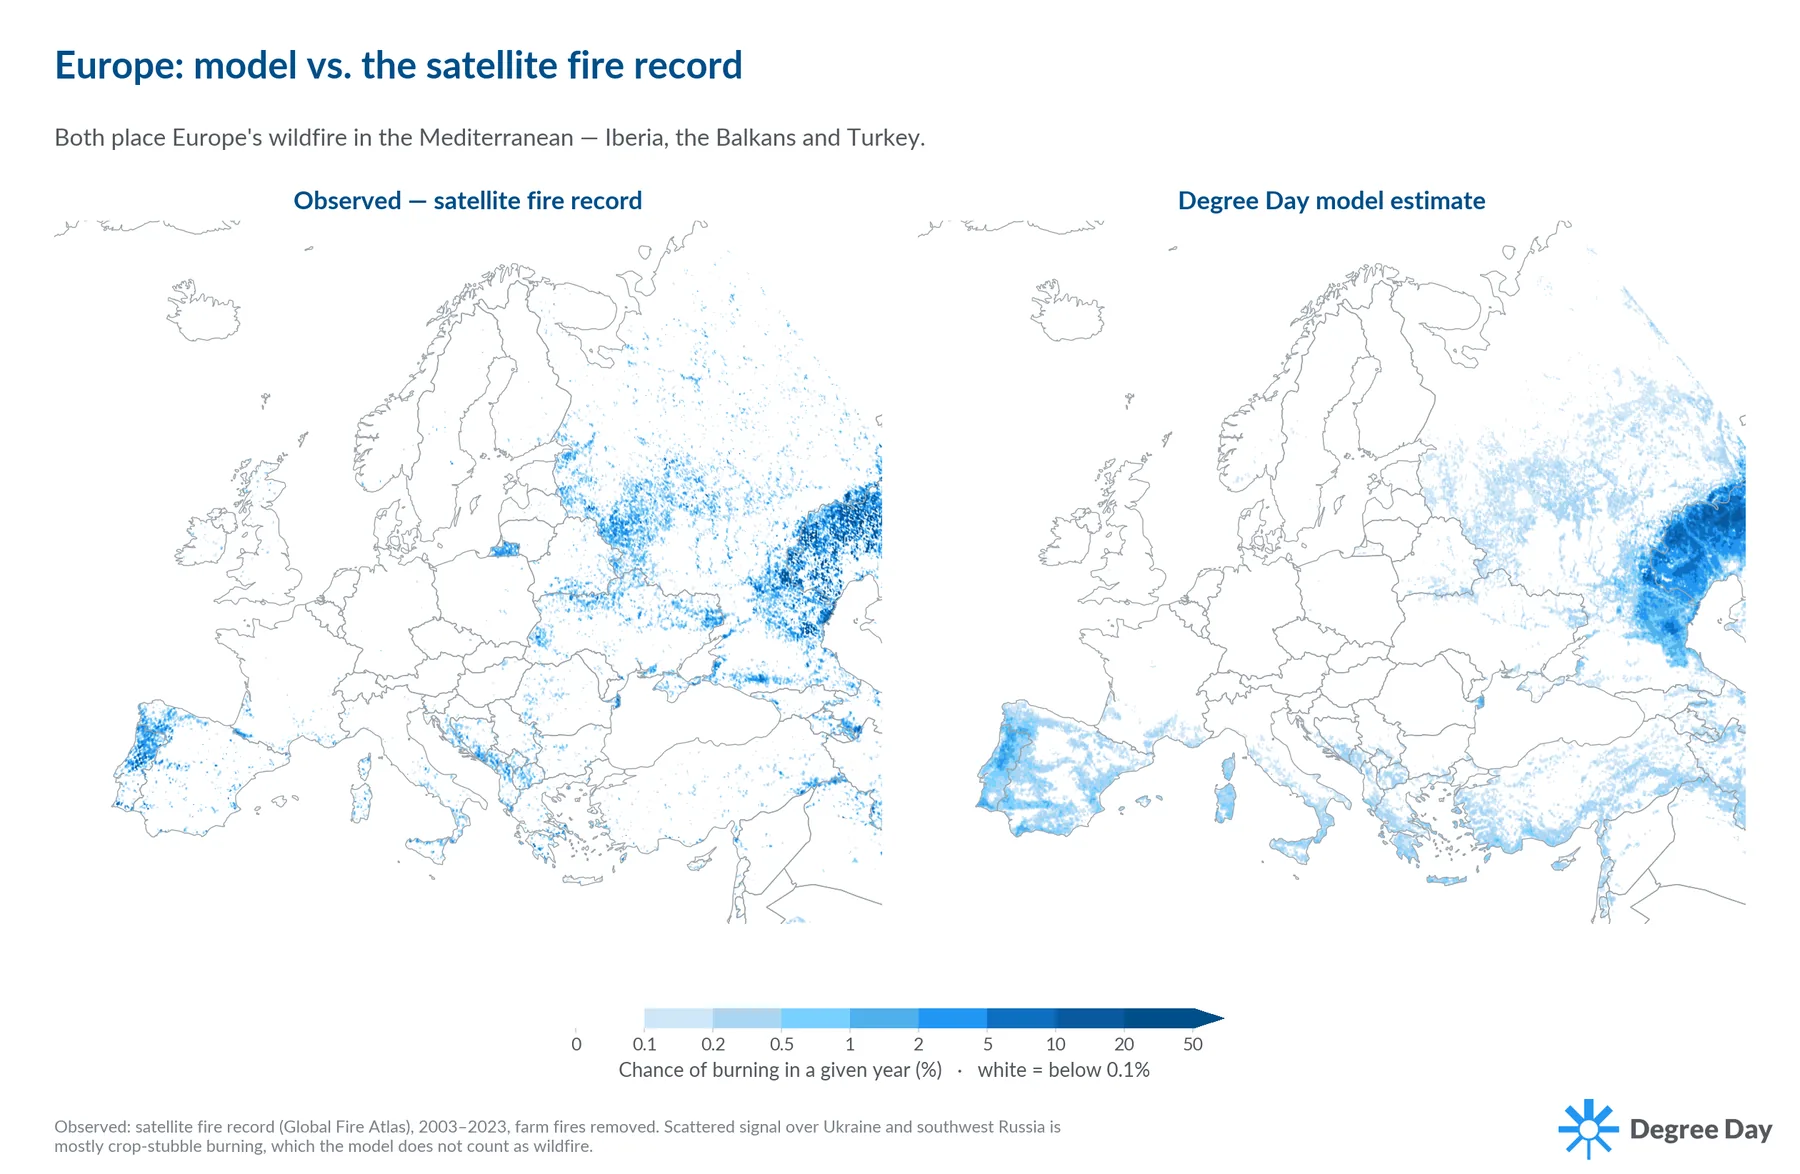
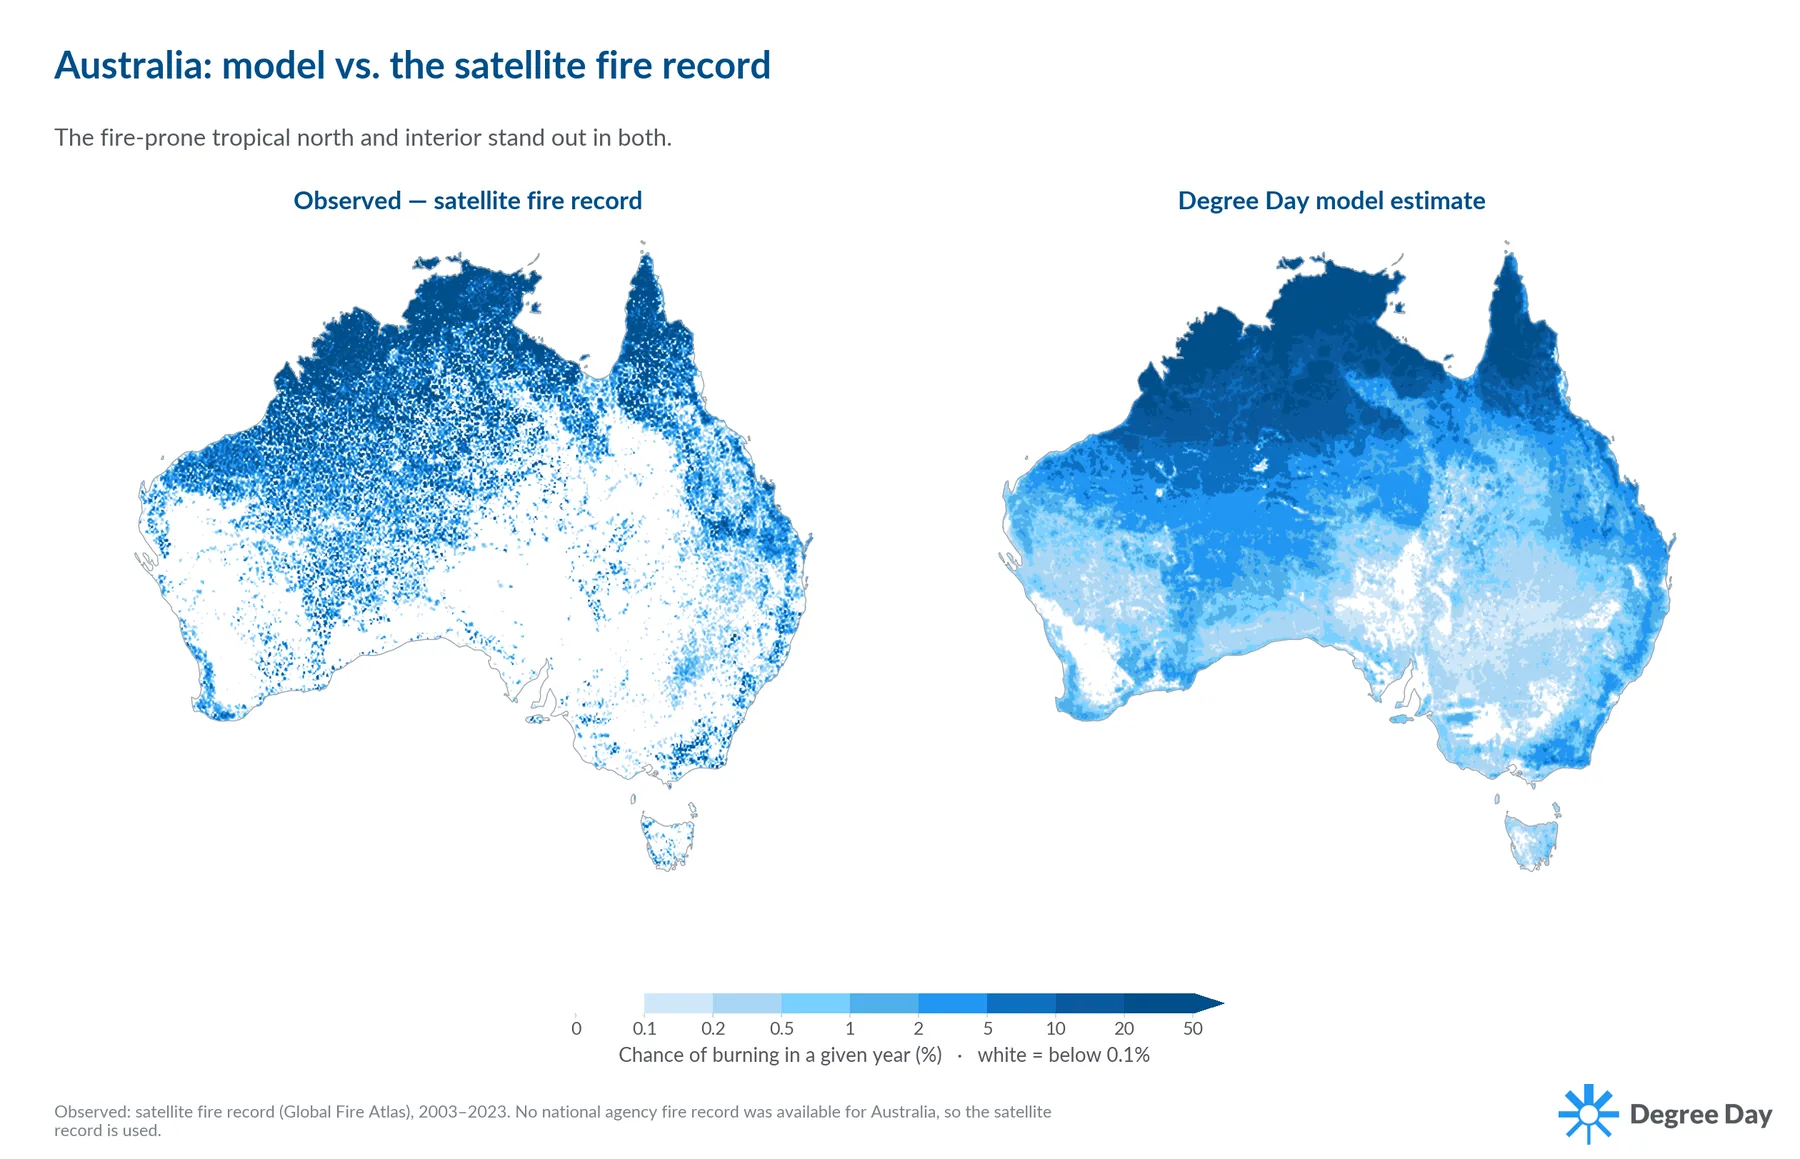
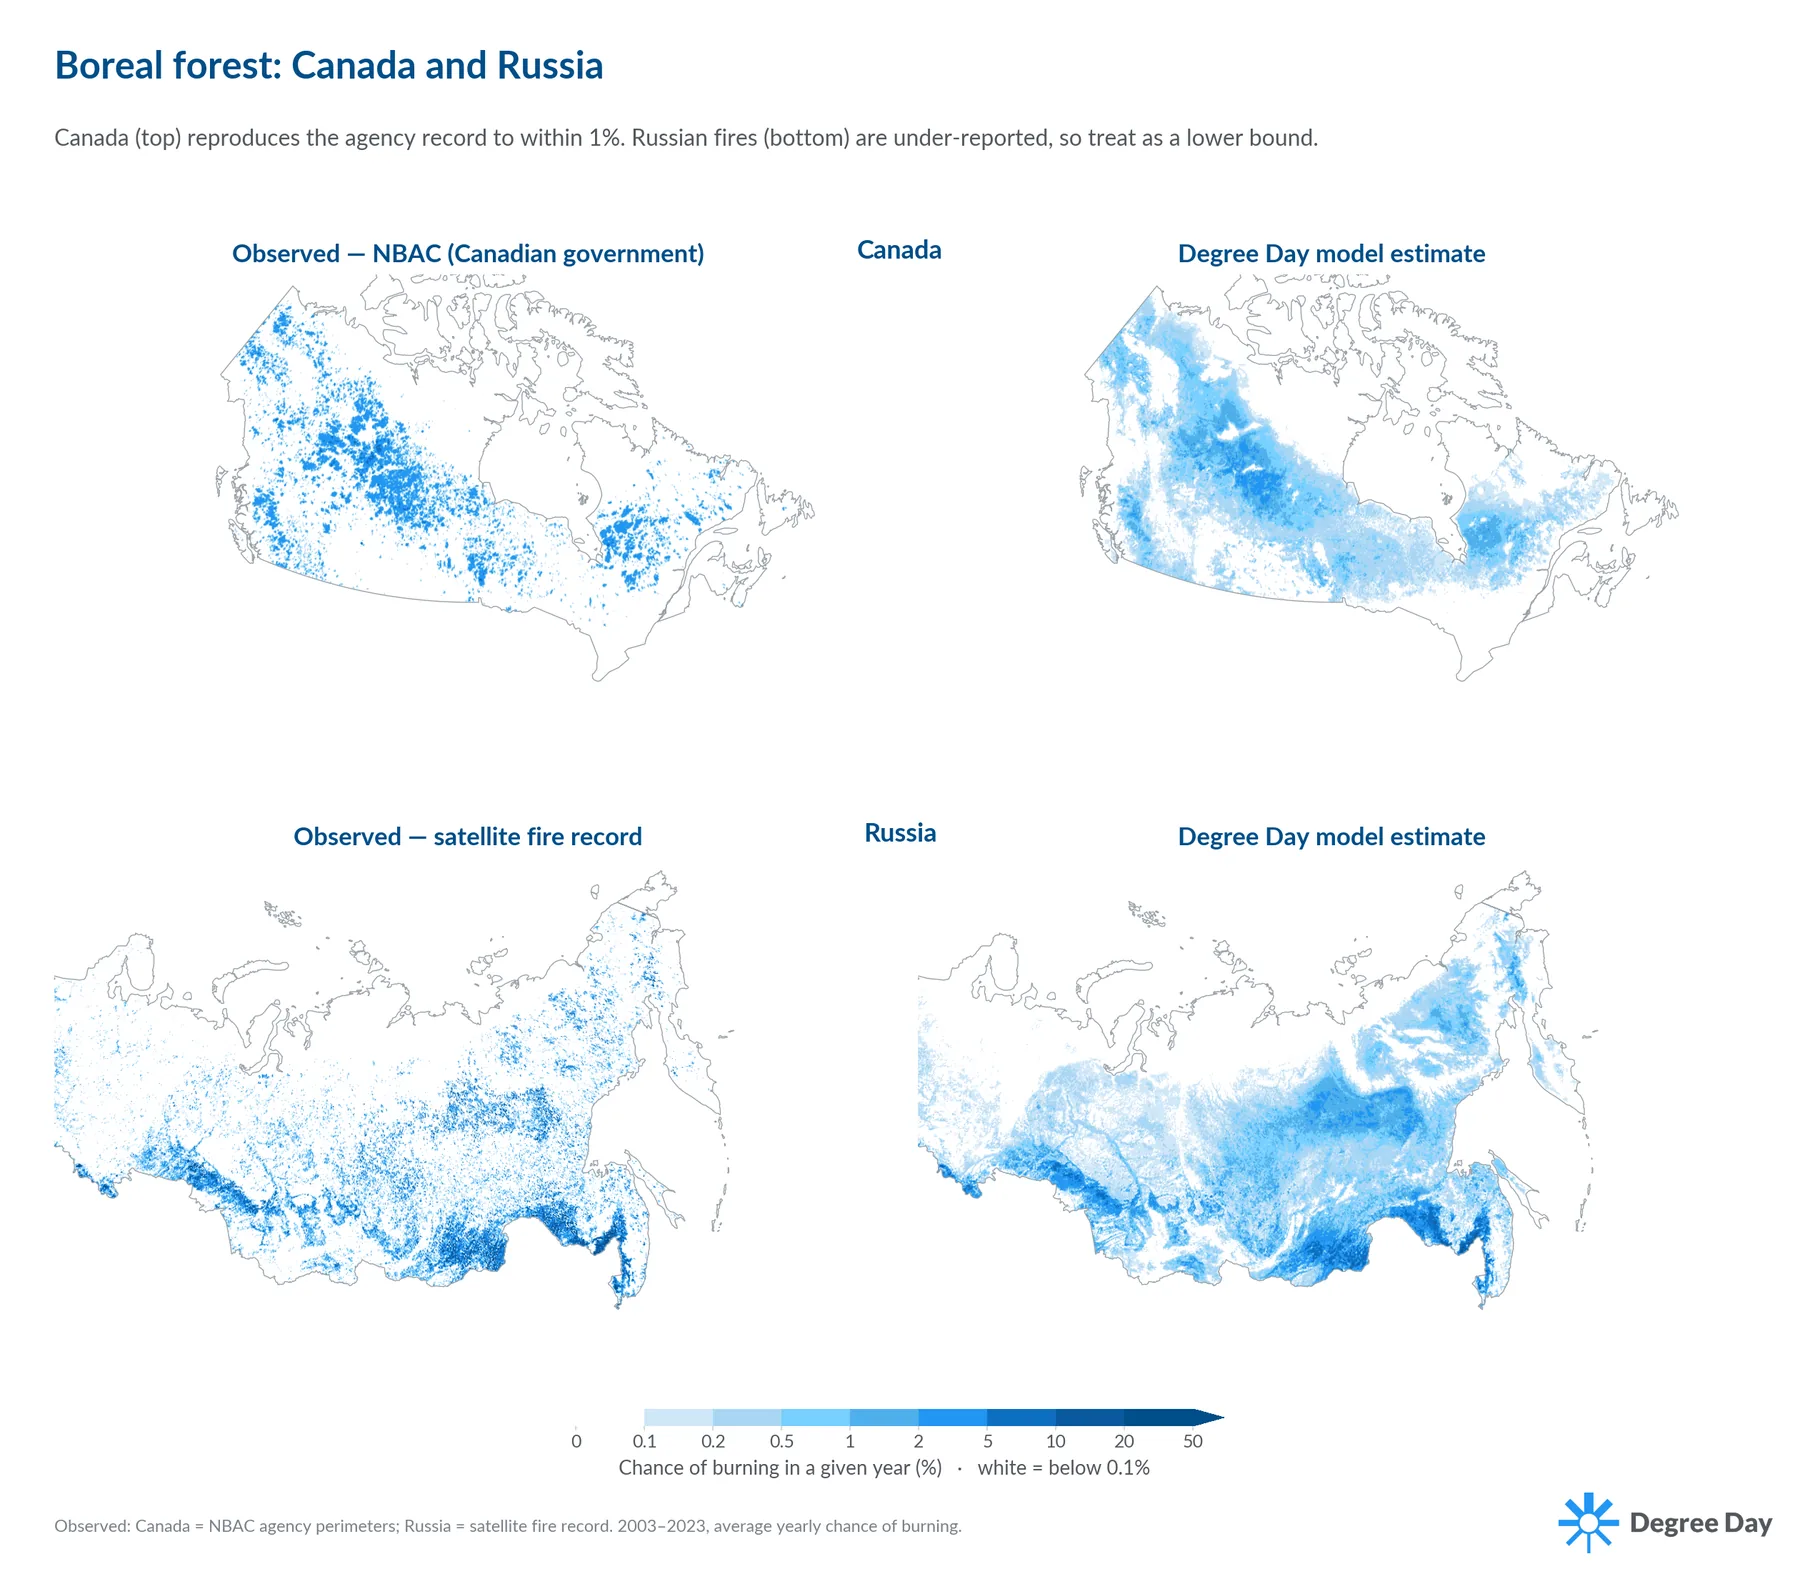
Across most regions the model separates fire-prone land from land that rarely burns, and reproduces the broad geography of fire in each independent record.
The prospective test
Reproducing the map of past fire is not a demanding test, because past fire is what the model was trained to explain. A more demanding test is whether the model can identify susceptible areas that have not burned previously.
We took land that did not burn between 2003 and 2012, asked the model to rank it from most to least susceptible, and then looked at where new fire actually broke out from 2013 to 2023. Because the model never sees a location’s own fire history, a high rating for a place that had never burned can only come from the conditions there.
We consider this the most informative validation we ran, because it tests the model on previously unburned land and subsequent fire occurrence.
Does the model spot fire before it happens?
Highest-ranked areas burned far more often over the following decade.
| Regionunburned areas checked | How often areas burned over the next decadeby fire susceptibility | Future burning in most fire-susceptible 20%share found there | Ranking skill0.5 random · 1.0 perfect |
|---|---|---|---|
| United States 78,139 |
84% |
0.88 | |
| Europe 78,549 |
87% |
0.90 | |
| Canada 124,095 |
90% |
0.90 | |
| Australia 37,741 |
49% |
0.85 |
Bars use the same 0–60% scale. “× avg” compares each group with its regional burn rate.
The direction is the same in every region, though the concentration is not. The tenth of previously unburned land ranked most fire-susceptible burned several times more often than the regional average in all four. How tightly later fire clustered at the very top varied: about 84% of Europe’s subsequent burning fell in that top tenth, roughly 55% in the United States and Canada, and about 27% in Australia. The next table sorts each region’s land into ten equal groups, from the most fire-susceptible tenth at the top to the least at the bottom, and shows how much of each group burned over the next decade.
Where the model ranked highest, fire followed
| United States | Europe | Canada | Australia | |
|---|---|---|---|---|
| Top 10% | 55 | 35 | 52 | 54 |
| 2nd | 29 | 1 | 34 | 43 |
| 3rd | 2 | 1 | 1 | 51 |
| 4th | 1 | 0 | 1 | 40 |
| 5th | 1 | 0 | 1 | 2 |
| 6th | 1 | 1 | 1 | 2 |
| 7th | 4 | 1 | 1 | 2 |
| 8th | 2 | 1 | 1 | 2 |
| 9th | 2 | 1 | 1 | 4 |
| Bottom 10% | 2 | 1 | 1 | 1 |
Each number is the share of that group that burned over the following ten years (%). The top groups burn far more than the bottom ones everywhere, but the drop-off is much sharper in Europe, the United States and Canada than in Australia.
The highest-ranked group burned between 25 and 42 times more often than the lowest-ranked group, depending on the region. In the United States, Europe and Canada, burn rates fall sharply below the highest-ranked groups: almost everything outside the top two burned at one or two percent. Australia shows a broader band of elevated susceptibility, with the top four groups all above 40%, although its lowest-ranked areas still burn much less often. Australia is also the region where the largest share of land burned regardless of rank, which leaves less room for any ranking to concentrate.
In all four regions the ranking was produced without fire-history predictors, so the separation comes from the drivers rather than from the earlier burn map.
Two fires from 2025
The model’s training data end in 2023, so any fire since then is out of sample.
The delivered layer placed nearly the entire footprints of the January 2025 Palisades and Eaton fires around the 89th to 90th percentile of fire-capable land worldwide. That is a rank, not a probability: land at the 90th percentile is rated more fire-susceptible than about 90% of the world’s burnable ground, which is not the same as a 90% chance of burning in a given year.
The model does not rank every burned area highly. For the August 2025 Aude fire in Mediterranean France, it placed the burned ground near the 70th percentile. That is above average, but not among the highest-ranked land.
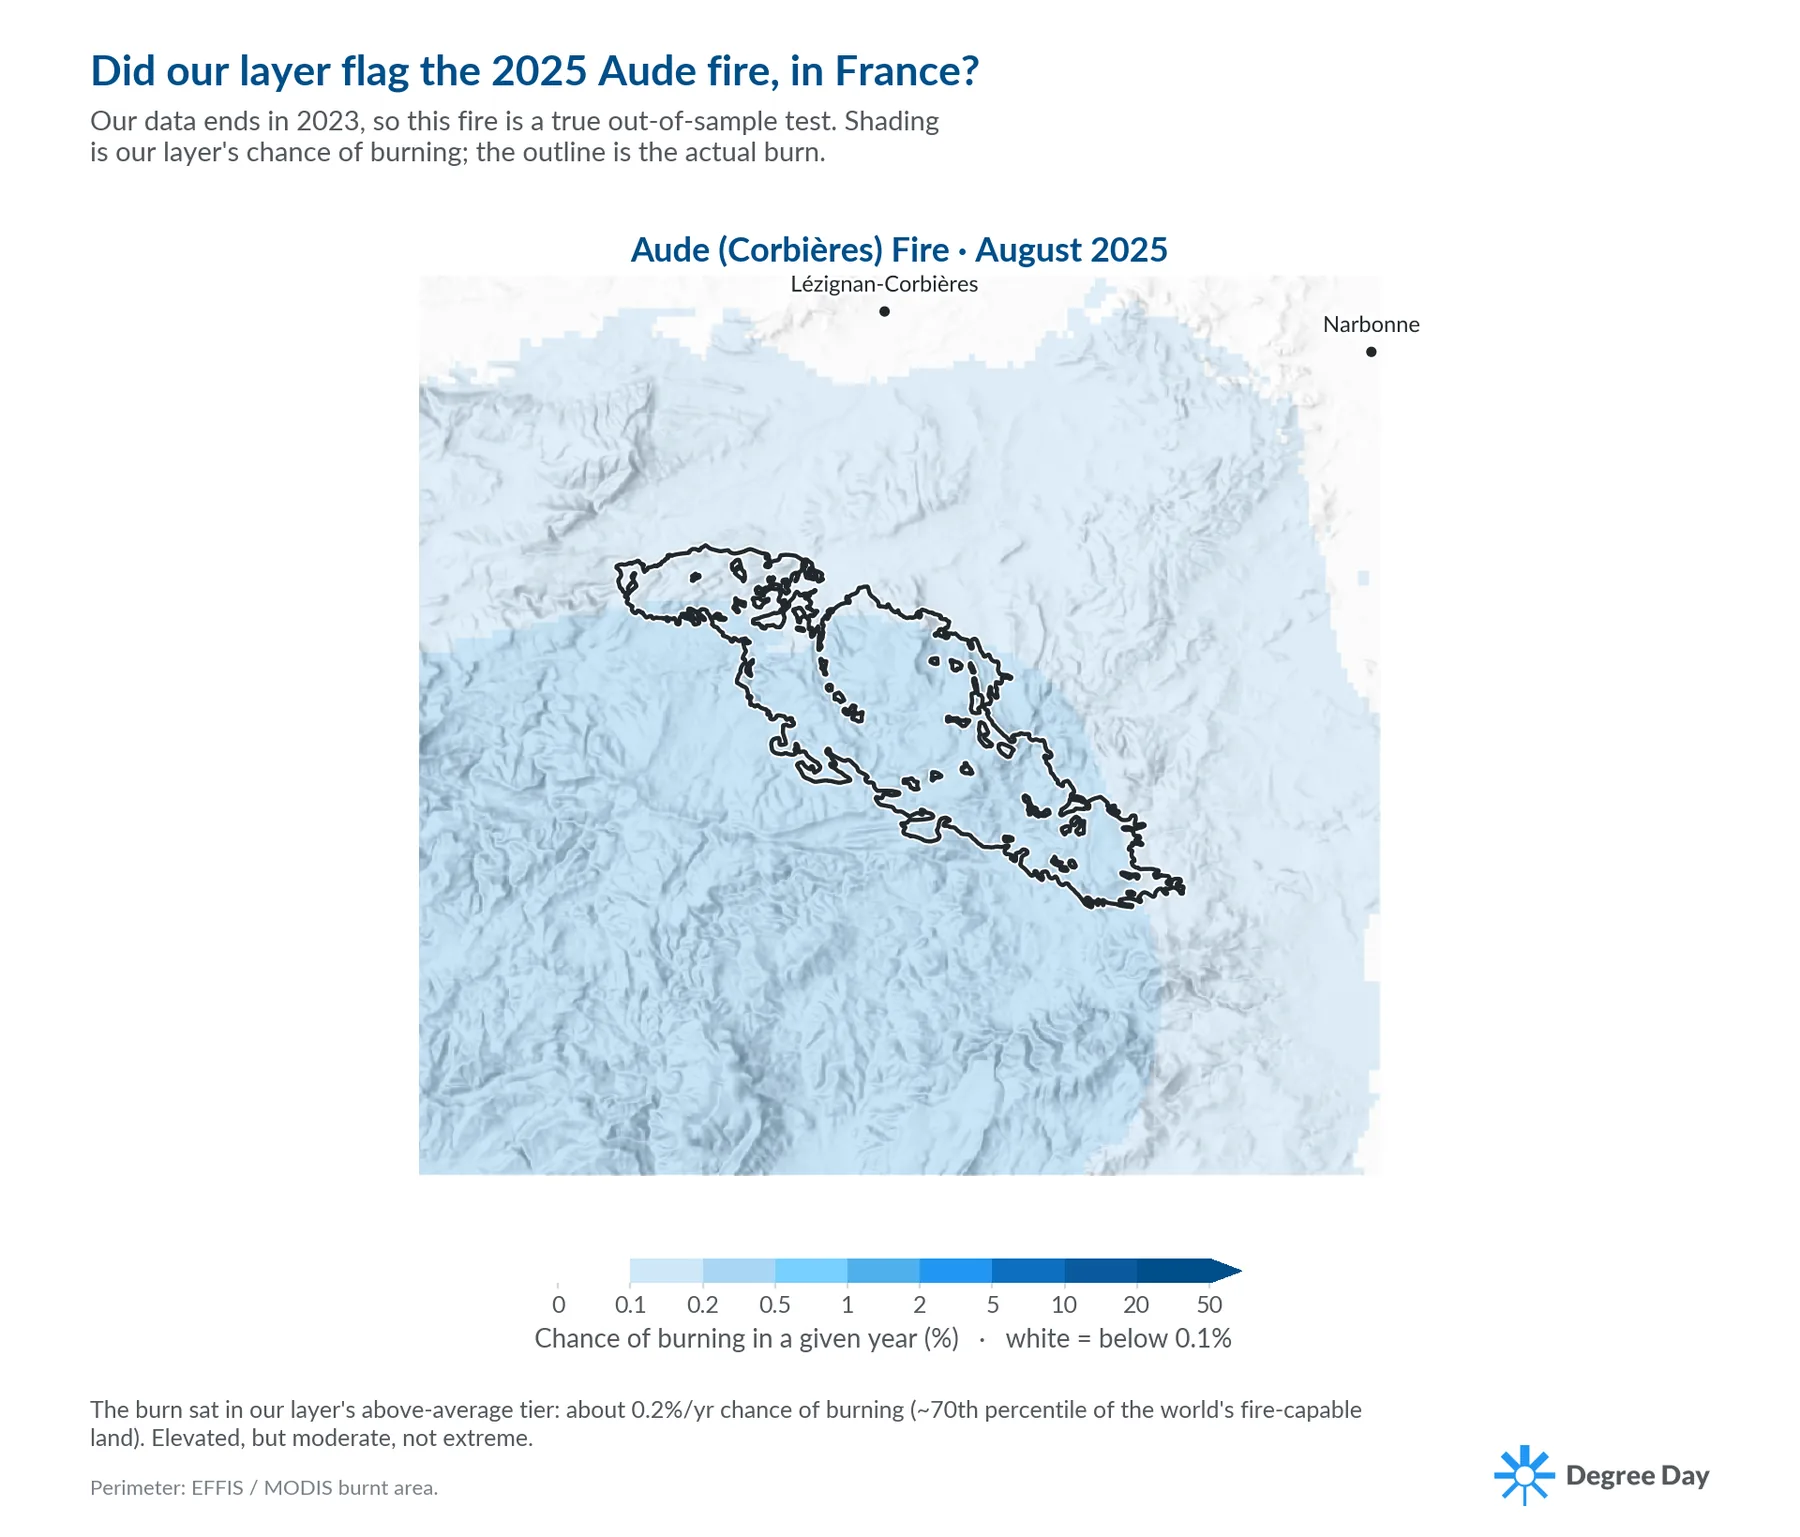
Two events cannot confirm or refute a probability. We include them because they are recent and out of sample, not as evidence of skill; the systematic tests above are what the skill claims rest on.
What the model does not tell you
The model estimates how susceptible a location is, given its fire weather, fuel, terrain and surrounding human activity. It does not estimate when a fire will start, how far it will spread, or what it will cost. It cannot anticipate the ignition itself. A downed power line, an escaped campfire, a roadside cigarette: none of these are predictable from the conditions on the ground. That is why we describe the output as susceptibility rather than a forecast of events.
What it does do, across every region we tested, is separate land that is primed to burn from land that is not, including places that have not burned yet. Used as a consistent basis for comparing and screening wildfire susceptibility, rather than as a prediction of individual fires, it answers the question we opened with. The next fire will surprise a lot of people. It should not surprise the map.
You can see the layer for any location in the Degree Day Hazard Viewer, or read how the model is built on the Global Wildfire Model page.
References
- Abatzoglou, J.T., Williams, A.P., & Barbero, R. (2019). Global emergence of anthropogenic climate change in fire weather indices. Geophysical Research Letters, 46(1), 326–336.
- Andela, N., Morton, D.C., Giglio, L., et al. (2019). The Global Fire Atlas of individual fire size, duration, speed and direction. Earth System Science Data, 11, 529–552.
- Eidenshink, J., Schwind, B., Brewer, K., et al. (2007). A project for monitoring trends in burn severity. Fire Ecology, 3(1), 3–21.
- Hall, R.J., Skakun, R.S., Metsaranta, J.M., et al. (2020). Generating annual estimates of forest fire disturbance in Canada: the National Burned Area Composite. International Journal of Wildland Fire, 29(10), 878–891.
- Jolly, W.M., Cochrane, M.A., Freeborn, P.H., et al. (2015). Climate-induced variations in global wildfire danger from 1979 to 2013. Nature Communications, 6, 7537.
- Ke, G., Meng, Q., Finley, T., et al. (2017). LightGBM: a highly efficient gradient boosting decision tree. Advances in Neural Information Processing Systems, 30.
- Lizundia-Loiola, J., Otón, G., Ramo, R., & Chuvieco, E. (2020). A spatio-temporal active-fire clustering approach for global burned area mapping at 250 m from MODIS data. Remote Sensing of Environment, 236, 111493.
- Los Angeles County Economic Development Corporation (LAEDC). (2025). Impact of the 2025 Los Angeles Wildfires and Comparative Study. LAEDC.
- San-Miguel-Ayanz, J., Schulte, E., Schmuck, G., et al. (2012). Comprehensive monitoring of wildfires in Europe: the European Forest Fire Information System (EFFIS). In Approaches to Managing Disaster.
