

Better models will not eliminate disagreement among climate-risk vendors. Rather than beginning with generic vendor data, organizations should first examine how extreme weather has affected their assets and operations, and how it could affect them in future, then determine which decisions require additional modeling support.
Every organization experiences climate risk differently. The consequences of an extreme weather event depend not only on location but also on asset characteristics, operational dependencies, disruption thresholds, supply chains, protective measures, and past experience.
That complexity limits the value of one-size-fits-all assessments produced by third parties. Generic climate-risk data, including estimates of average annual loss, can help screen portfolios, flag potential hazards, and prioritize further investigation. On its own, however, such data rarely provide enough information to determine how a particular organization could be affected or what actions it should take.
Effective climate-risk management requires an organization-led approach that combines hazard data and modeling with the organization’s technical expertise, operational knowledge, and decision needs. The result is a more credible understanding of risk and a clearer basis for practical, targeted action.
This approach also reduces reliance on any individual dataset or model being precisely correct. Climate-risk models will always be constrained by uncertainty about the future, incomplete information, and methodological choices. They can nevertheless support sound decisions when interpreted alongside the organization’s own knowledge. The goal is to identify actions that remain effective across a range of possible futures and do not depend on any one model being correct.
The Models Continue to Disagree
Models are inherently simplified representations of reality. They can capture important features of a system, but they cannot reproduce it perfectly. Their outputs depend on the data, assumptions, methods, and parameters selected by their developers.
There is growing evidence that treating generic vendor data as a definitive asset-level assessment creates an unstable basis for organizational climate-risk decisions.
In 2025, the Global Association of Risk Professionals, working with the Climate Financial Risk Forum, asked 13 leading climate-risk vendors to analyze the same 100 properties for the same hazards under the same emissions scenario.1 Across multiple perils, estimates of expected losses differed by factors of two to ten. In some cases, vendors could not agree on whether a hazard existed at all. For one coastal property, one provider assessed no flood exposure while others projected significant risk at the same location.
The Investor Leadership Network found a similar pattern in a separate comparison of seven vendors.2 Across three sample real-estate assets, no two vendors agreed on the two most significant hazards.
Similar disagreement has been found in other independent comparisons and in the peer-reviewed literature. Researchers have found substantial divergence among climate-risk providers, global tropical-cyclone loss models, and national flood-hazard datasets.3–5
These findings may be unsettling to organizations expecting climate data to provide definitive guidance for decision-making. But they are not surprising given how climate-risk estimates are produced.
Climate-risk estimates emerge from a long chain of models, assumptions, and methodological choices. Many of the underlying inputs and assumptions are uncertain, and several defensible methods may be available. Different models can therefore produce materially different answers without any one of them being obviously or entirely wrong.
Why Better Models Will Not Eliminate Model Divergence
Model disagreement often prompts organizations to search for a more accurate vendor, assuming that better data, greater computing power, and more sophisticated methods will eventually cause estimates to converge on the “truth.”
Model quality matters. Vendor selection can screen out weak methods, reveal limitations, and identify approaches suited to the intended use. Better observations, hazard models, and estimates of asset and operational response can strengthen individual components of an assessment.
But better modeling cannot eliminate the fundamental sources of disagreement.
First, generic models lack much of the information needed to understand how an organization would experience an extreme event. They may characterize a hazard at a location, but rarely capture asset condition, protective measures, maintenance, operational dependencies, disruption thresholds, supply-chain exposure, recovery capacity, or adaptability. These details can materially change the consequences.
Second, even technically strong models cannot perfectly represent a complex and uncertain future. Asset-level estimates rest on a cascade of models and assumptions:
Climate → hazard → vulnerability → financial consequence
The climate stage includes choices about emissions pathways, climate models, bias correction, and downscaling. The hazard stage translates that information into a physical event or condition, such as flood depth, wildfire probability, or extreme temperature. Vulnerability describes how the asset responds. The financial-consequence stage estimates what that response means for the organization in economic terms.
At each stage, several defensible methods and assumptions may be available. Individually reasonable choices can compound, producing substantially different financial-consequence estimates from the same starting point.6
The climate information entering this cascade is also uncertain. Regional projections vary across climate models, downscaling methods, bias-correction techniques, and natural variability.7–12 Greater spatial resolution may add useful detail, but it does not resolve uncertainty about where, when, and how a future extreme event will affect a particular business.13
Model divergence is therefore largely an inherent feature of the problem rather than evidence that a particular model is poor. Vendors may use credible methods and best-available inputs and still reach materially different answers. Better models may narrow the range and make assumptions more transparent, but they cannot produce one universally correct estimate for every asset and decision.14
The goal should therefore not be to identify the vendor with the one “right” number. For many asset-level questions, and especially for estimates of future annual loss, no answer can be directly observed or independently verified as correct. Results depend on uncertain hazards, incomplete knowledge of asset and operational response, and choices about which consequences count as loss.
When probabilities are uncertain but organizational vulnerabilities can be identified, the task should shift. Rather than trying to pin down the precise likelihood of loss, the assessment can examine how the organization would perform under physically plausible and decision-relevant conditions.
Start With What Matters to the Organization
A better way forward begins with the organization rather than with climate-risk data.
The first task is to identify the assets, operations, and external dependencies that are essential to organizational performance, along with the conditions under which they could be disrupted.
This includes not only direct physical damage but also disruptions to electricity, water, sanitation, transportation, labor, suppliers, customers, communications, and other critical services. A facility may remain physically intact while losing access to power, critical inputs, transportation routes, or employees.
Historical experience provides a useful starting point. Past weather events can reveal which parts of the organization were affected, how disruptions propagated, and where existing protections proved inadequate.
Incident reports, insurance claims, maintenance records, financial accounts, business-continuity exercises, and staff interviews can reveal links between weather conditions and operational or financial outcomes.
The objective is to identify disruption thresholds: the conditions under which a physical hazard begins to produce material consequences.
A temperature of 40°C (104°F) in London is not inherently a material business risk. Its significance depends on whether it exceeds equipment specifications, reduces worker productivity, constrains cooling systems, increases electricity demand, or coincides with a grid outage.
A flood depth becomes meaningful only in relation to floor elevations, critical equipment, access routes, drainage capacity, protective infrastructure, and the duration of the disruption.
Relevant thresholds may come from:
- previous events and near misses;
- engineering design standards and safety margins;
- operating limits for equipment and infrastructure;
- business-continuity plans and recovery-time objectives;
- supplier, transportation, and utility dependencies; and
- local knowledge held by employees, engineers, facility managers, emergency planners, and community stakeholders.
This process does not replace climate and hazard modeling; it gives the modeling a clearer purpose.
Once the relevant vulnerabilities, locations, variables, and timescales are understood, models can be selected and evaluated against a specific decision need.
The approach changes from:
What does the climate-risk data tell us to focus on?
to:
What extreme weather conditions could materially disrupt the organization, and how might those conditions change over time?
Use Event-Based Storylines to Stress-Test Plausible Futures
Event-based storylines provide one way to answer that question without requiring a precise probability for every possible outcome.
A storyline is a physically plausible description of an event or sequence of events and the consequences that could follow. Rather than reducing risk to a single score or expected annual loss, it traces how a particular hazard interacts with the organization’s assets, vulnerabilities, and dependencies.
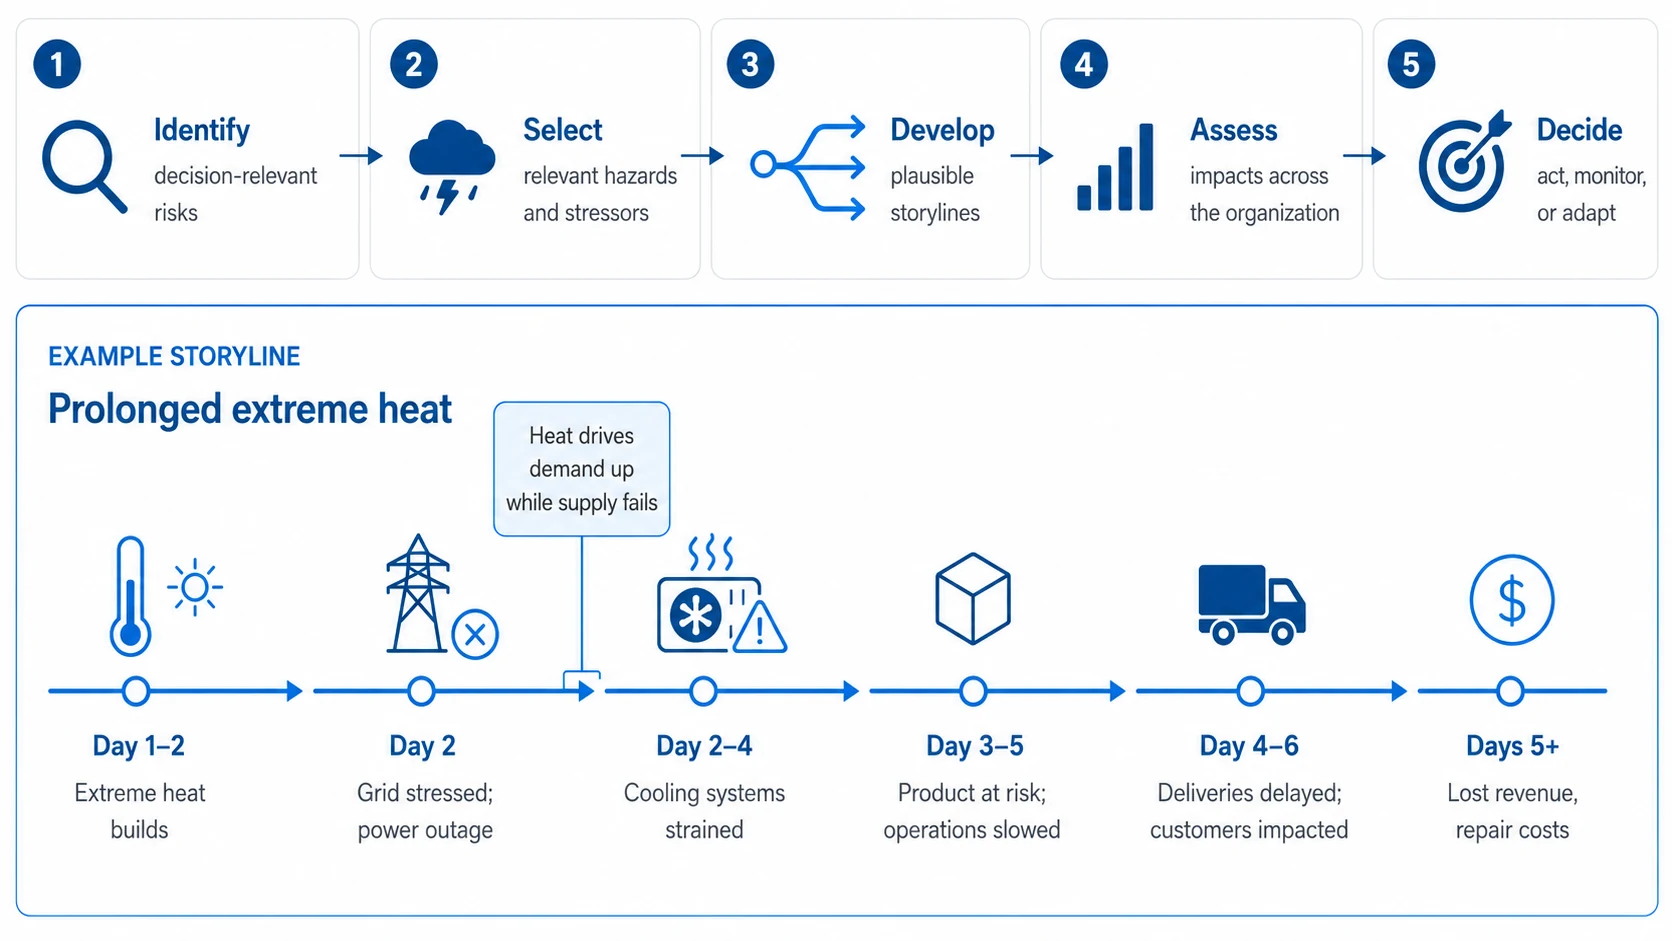
A storyline workflow moves from the organization’s own decision-relevant risks to the hazards that could trigger them, then traces a plausible event through the organization day by day. The consequences accumulate across systems the organization depends on, not only the asset itself.
A storyline might ask:
- What would happen if an extreme heatwave coincided with a multiday electricity outage?
- What if flooding left a facility undamaged but closed its only access route?
- What if a hurricane disrupted both a critical supplier and the port through which replacement materials arrive?
- What if a multiyear drought constrained water availability across an entire operating region?
- What if several moderate events occurred in close succession, depleting inventories and delaying recovery?
These scenarios are not forecasts. They do not claim that a particular event will occur at a particular place and time, nor do they require a precise annual probability, which may be impossible to estimate credibly.
Their value lies in helping organizations explore plausible events that matter to them and uncover vulnerabilities that broad risk scores may miss. Storylines are especially useful when the likelihood of rare events cannot be estimated with confidence.15–17
Storylines Can Still Be Highly Quantitative
Hazard models can estimate flood depths, wind speeds, heat exposure, wildfire behavior, or drought conditions. Engineering analysis can determine whether physical thresholds are exceeded. Operational and financial models can then estimate downtime, repair costs, lost production, supply-chain disruption, and cash-flow impacts.
The difference is that the numbers are organized around a decision-relevant event rather than presented as a definitive estimate of future risk.
Climate models remain important, but they become one line of evidence among several. They may help assess whether the drivers of a relevant event are likely to intensify, become more frequent, shift seasonally, or interact differently in a warmer climate.
Historical events can also be adjusted to reflect higher sea levels, warmer temperatures, heavier rainfall, drier fuels, or other changing conditions. A past event can serve as a starting point and be modified to examine how its effects might differ under current or future conditions.18
Storyline-Based Assessment Is Inherently Collaborative
Climate scientists may help characterize the physical event. Engineers may identify failure thresholds. Operations teams may trace dependencies and recovery constraints. Financial teams may evaluate material consequences. Local experts may identify social, environmental, and institutional conditions that influence the outcome.
This process creates an auditable chain connecting a plausible physical event to a specific organizational consequence. It shows not only that an organization may be exposed, but how disruption could occur, which assumptions matter, and where intervention would be most effective.
Example: Extreme Heat at a Regional Distribution Center
Consider a regional distribution center that serves several retail stores and depends on refrigeration, automated sorting equipment, and daily truck access.
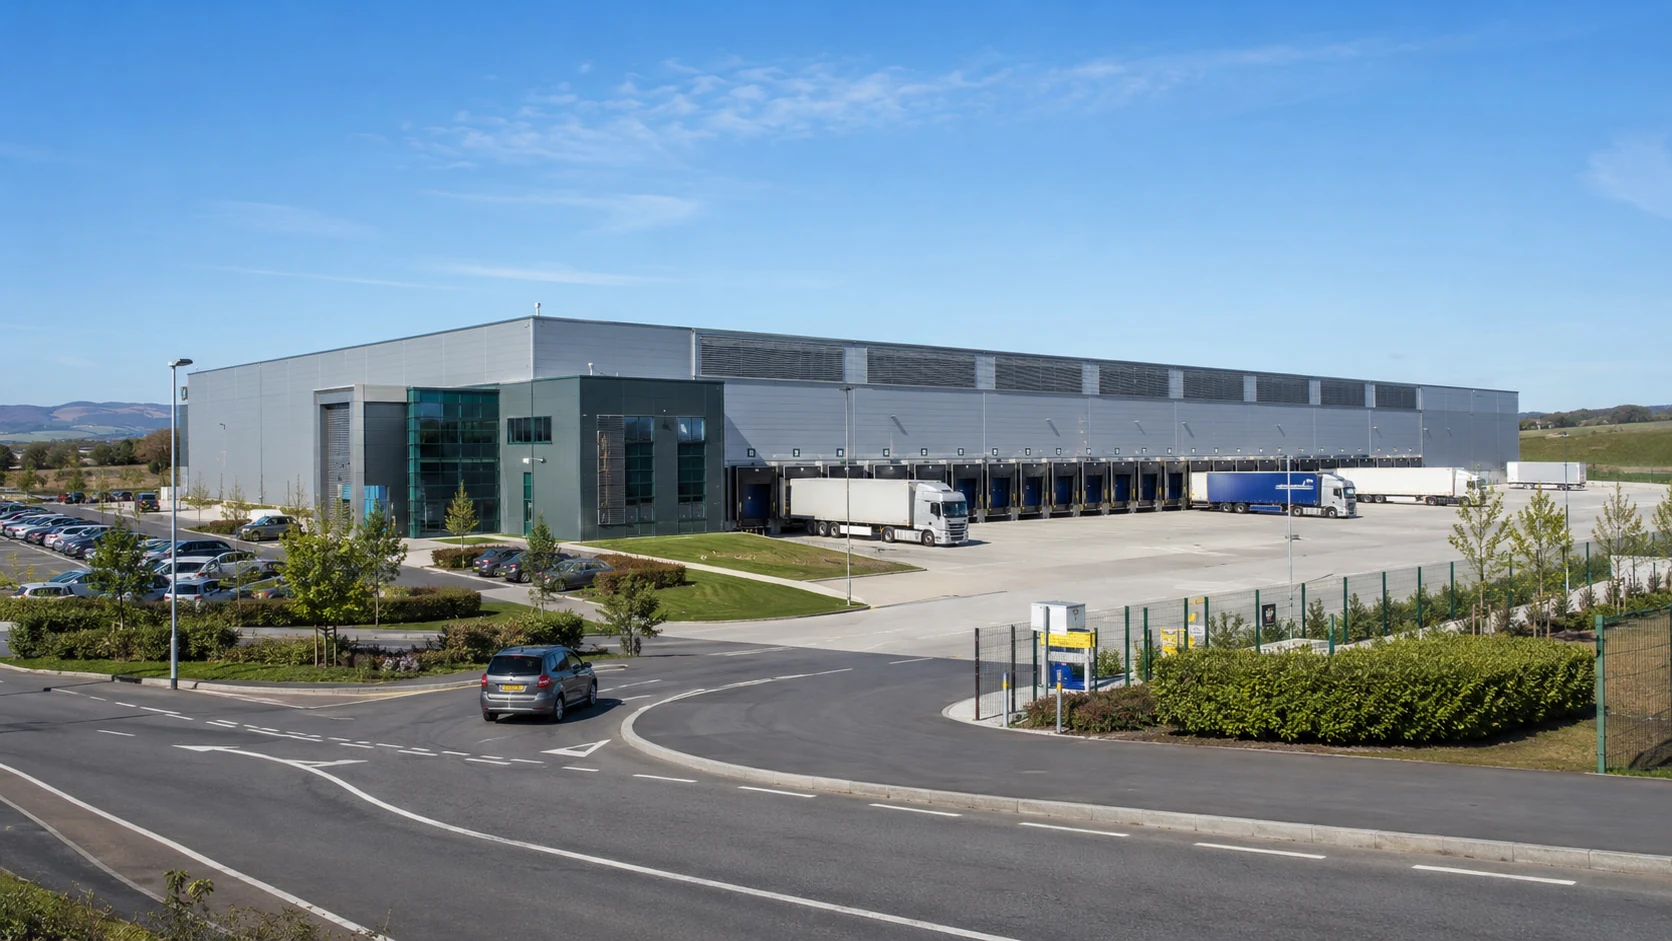
The hazard score for a facility like this says little about whether it can keep operating. Refrigeration limits, backup-generator capacity, loading-dock throughput, a single substation, and two days of inventory are what determine the consequences of a heatwave.
A conventional vendor assessment might assign the property a moderate heat-risk score based on projected increases in extreme temperatures. That score may be useful for high-level screening, but it says little about whether the facility can continue operating.
An organization-led assessment would begin by identifying the conditions that could disrupt the business.
Facility staff may know that refrigeration equipment begins losing efficiency above 38°C (100°F), the backup generator can support only critical cooling systems, and loading operations slow substantially when outdoor temperatures remain above 40°C (104°F) for several hours. They may also know that the facility relies on a single electricity substation and has only two days of refrigerated inventory capacity.
An event-based storyline could then examine a physically plausible five-day heatwave in which:
- daytime temperatures exceed 40°C (104°F);
- nighttime temperatures remain unusually high;
- regional electricity demand reaches record levels; and
- the facility experiences a 12-hour power interruption.
Climate models and datasets may overestimate or underestimate the frequency, duration, or intensity of these conditions at the facility. That uncertainty is important and should be communicated.
Where multiple lines of evidence indicate a clear upward trend in extreme heat, the more useful question is whether the facility’s known operating limits are increasingly likely to be exceeded.
The warehouse itself may suffer no structural damage. Nevertheless, the event could cause refrigeration failures, product spoilage, reduced worker productivity, delayed shipments, overtime costs, and shortages at downstream stores.
If the same heatwave also affects transportation providers, suppliers, or the regional electricity system, recovery could take several days after power is restored.
Engineers can estimate cooling loads and equipment performance under the specified temperatures. Operations staff can identify inventory, staffing, and delivery constraints. Financial teams can calculate spoilage, lost sales, overtime, and recovery costs.
The objective is to determine whether the event is plausible, whether the organization could withstand it, and which interventions would reduce the consequences.
Those interventions might include:
- increasing backup-power capacity;
- improving temperature and equipment monitoring;
- revising inventory and delivery practices;
- adding redundancy to critical cooling systems;
- arranging temporary refrigerated storage; or
- developing procedures for transferring products to another facility.
The best intervention may remain cost-effective across a wide range of assumptions about the frequency and severity of future heat. That is the central advantage of the approach: the decision does not depend on one model producing the correct point estimate.
From Assessment to Action
A practical organization-led assessment can be organized around three stages.
1. Identify Decision-Relevant Risks
Begin with the organization’s assets, operations, dependencies, and historical experience.
Identify previous disruptions and near misses. Determine which hazards contributed to them, how the effects propagated, and which physical or operational thresholds were exceeded.
The objective is not to catalogue every conceivable climate hazard, but to identify the conditions capable of producing material consequences for the organization.
2. Analyze Plausible Consequences
Construct event-based storylines around the most important vulnerabilities.
Use climate and hazard models where they provide decision-relevant information, while recognizing where probabilities and localized changes remain uncertain. Combine those outputs with engineering analysis, operational knowledge, supply-chain information, and financial data.
Quantify impacts where credible. Describe them qualitatively where quantification would imply false precision.
3. Act, Adapt, or Monitor
Determine whether the analysis supports immediate action.
Where intervention is justified, favor actions that remain beneficial across a range of plausible conditions rather than those optimized for one modeled future. Robust decision-making methods are specifically designed for situations in which uncertainty cannot be reduced to a single reliable forecast.19, 20
Not every identified risk will justify immediate investment. Where action is premature, organizations can establish monitoring indicators, decision triggers, and a process for revisiting the assessment as conditions, operations, or evidence change.
A More Useful Climate-Risk Assessment
Climate-risk models provide valuable information, but they cannot deliver a single definitive estimate of how a specific organization will be affected. Their outputs reflect limitations in the available data, methodological choices, incomplete knowledge of assets and operations, and futures that cannot be predicted precisely.
Better models can improve the analysis. They cannot remove these limitations.
The practical response is not to abandon modeling or wait for every model to converge on the right answer. It is to use models differently: as inputs to a decision process grounded in known vulnerabilities, engineering constraints, operational knowledge, and plausible events.
The objective is not to identify the exact 1-in-50-year event or the vendor with the one correct number. It is to understand where the organization is vulnerable, which assumptions affect the decision, and which actions remain sensible even when the models disagree.
Degree Day helps organizations apply this approach by combining climate and hazard modeling with expertise in model limitations, uncertainty, and engineering decision-making. We help organizations identify which data are relevant to a decision, where quantitative results are reliable, where caution is warranted, and how imperfect information can support practical risk-management decisions.
A useful climate-risk assessment does not need to predict the future exactly. It needs to help an organization decide what to do.
References
-
GARP Risk Institute & Climate Financial Risk Forum Financial Resilience Working Group. (2025). A Risk Professional’s Guide to Physical Risk Assessments: A GARP Benchmarking Study of 13 Vendors. Climate Financial Risk Forum.
-
Investor Leadership Network. (2026). Why Vendors Disagree: A Practical Guide to Evaluating Physical Climate Risk Data Vendors.
-
Chegwidden, O., Koerth, M., & Freeman, J. (2024). Climate risk companies don’t always agree. CarbonPlan.
-
Meiler, S., et al. (2022). Intercomparison of regional loss estimates from global synthetic tropical cyclone models. Nature Communications, 13, 6156.
-
Schubert, J. E., Mach, K. J., & Sanders, B. F. (2024). National-scale flood hazard data unfit for urban risk management. Earth’s Future, 12(7), e2024EF004549.
-
Fiedler, T., et al. (2021). Business risk and the emergence of climate analytics. Nature Climate Change, 11, 87–94.
-
Doblas-Reyes, F. J., Sörensson, A. A., et al. (2021). Linking global to regional climate change. In Climate Change 2021: The Physical Science Basis (Chapter 10, pp. 1363–1512). Cambridge University Press.
-
Pitman, A. J., et al. (2022). Acute climate risks in the financial system: Examining the utility of climate model projections. Environmental Research: Climate, 1, 025002.
-
Ekstrom, M., Grose, M. R., & Whetton, P. H. (2015). An appraisal of downscaling methods used in climate change research. WIREs Climate Change, 6(3), 301–319.
-
Maraun, D. (2016). Bias correcting climate change simulations: A critical review. Current Climate Change Reports, 2, 211–220.
-
Lafferty, D. C., & Sriver, R. L. (2023). Downscaling and bias-correction contribute considerable uncertainty to local climate projections in CMIP6. npj Climate and Atmospheric Science, 6, 158.
-
Deser, C., et al. (2020). Insights from Earth system model initial-condition large ensembles and future prospects. Nature Climate Change, 10, 277–286.
-
Hall, A. (2014). Projecting regional change. Science, 346(6216), 1461–1462.
-
Steinberg, N. (2026). Why vendors disagree: A practical guide to evaluating physical climate risk data. GARP Risk Intelligence.
-
Shepherd, T. G., et al. (2018). Storylines: An alternative approach to representing uncertainty in physical aspects of climate change. Climatic Change, 151, 555–571.
-
Sillmann, J., et al. (2021). Event-based storylines to address climate risk. Earth’s Future, 9, e2020EF001783.
-
Fiedler, T., et al. (2024). Storylines: A science-based method for assessing and measuring future physical climate-related financial risk. Accounting & Finance.
-
van Garderen, L., Feser, F., & Shepherd, T. G. (2021). A methodology for attributing the role of climate change in extreme events: a global spectrally nudged storyline. Natural Hazards and Earth System Sciences, 21, 171–186.
-
Lempert, R. J., Popper, S. W., & Bankes, S. C. (2003). Shaping the Next One Hundred Years: New Methods for Quantitative, Long-Term Policy Analysis. RAND Corporation.
-
Hallegatte, S., et al. (2012). Investment Decision Making Under Deep Uncertainty: Application to Climate Change. World Bank Policy Research Working Paper No. 6193.
